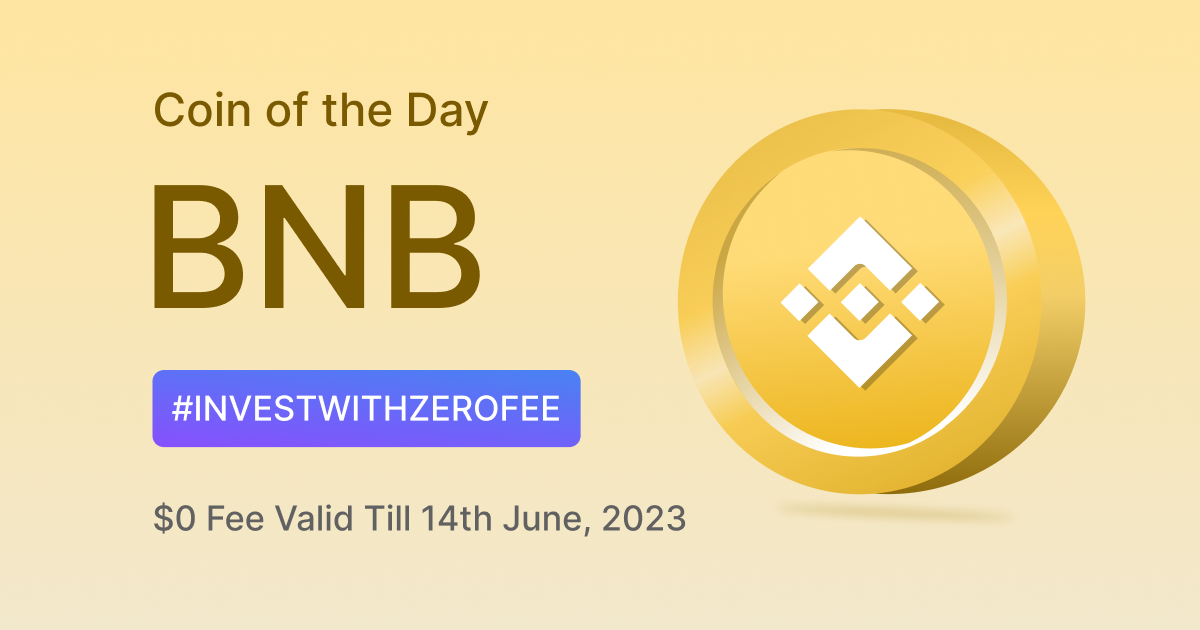
Presenting the ‘Coin Of The Day’ series by Mudrex.
As part of this series, we are making a detailed report of one cryptocurrency every day for the next 15 days. This will help you make informed investments in Coins during Mudrex’s $0 fee spree. Each report will share a comprehensive view of a cryptocurrency by evaluating it on various fundamental, social, and technical parameters and also assign an aggregated score to them.
So, let’s begin!
#Day 1 – Coin Of The Day Report for BNB
BNB Score
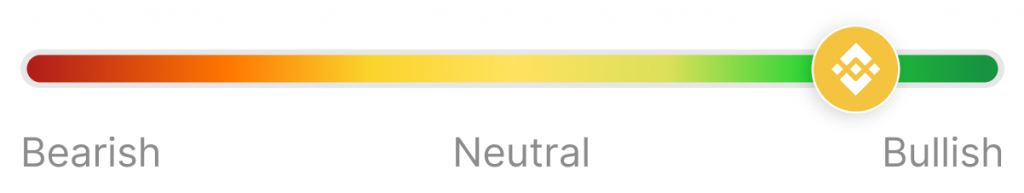
The bullish score for BNB indicates that the cryptocurrency is strong on its fundamentals and has been growing at a healthy rate.
How Did We Arrive at This Score?
We evaluated BNB on 4 critical parameters that give a 360 view of the cryptocurrency.
1. Price Performance ✅
Though past price movements don’t necessarily dictate future prices, it’s good to know how your potential investments have performed historically.
2. Fundamental Analysis ✅
In this section, we evaluate the BNB Chain on some critical on-chain metrics.
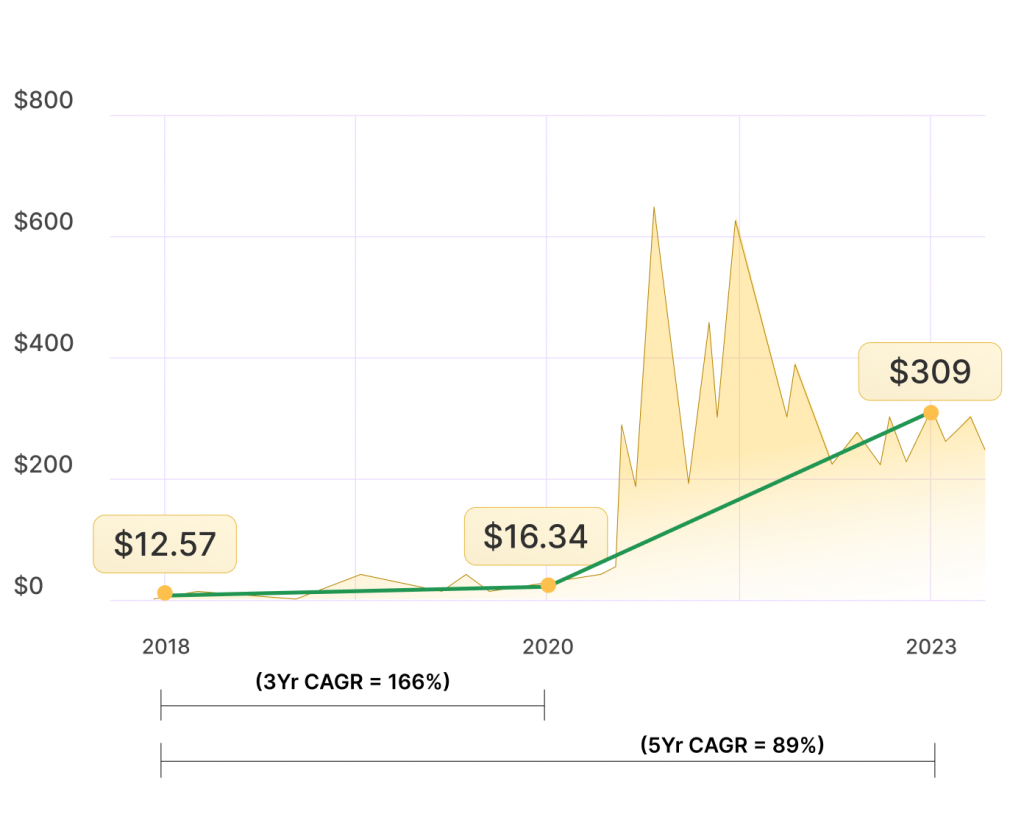
2.1. Active Address Count
This depicts the overall activity on the network. A growing active address count signals a growing network and impacts the price of the network token positively.
Monthly active addresses on the BNB Chain grew from ~ 38.2k to around 10.2M between 2020 to 2023 at a compounded annual growth rate of ~544%. This was primarily driven by the launch of Uniswap and various GameFi and SocialFi applications.
2.2. NVT Ratio
💡 NVT Ratio: It compares the market cap of a cryptocurrency to its transaction volume. A high NVT ratio indicates that the market cap is outpacing the transaction volume, which may be a sign of a bubble. A very low NVT ratio would mean the token is currently highly undervalued.
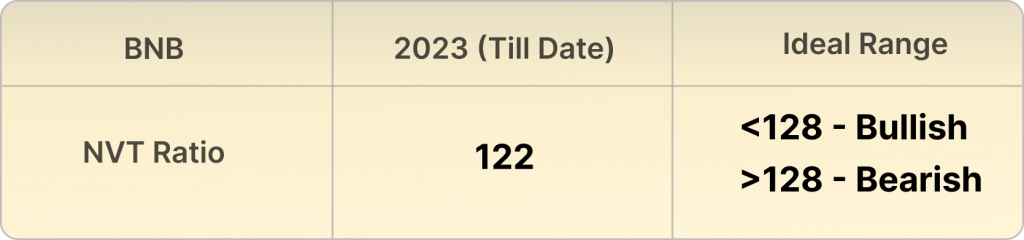
P.S. This ratio shouldn’t be looked at in isolation and must always be combined with other indicators. As a general rule of thumb, an NVT ratio that is more than twice the historical average is considered to be significantly higher
2.3. Blockchain Network Profitability
This is measured by deducting the net incentives given to network participants like miners and validators, from the net income generated by the platform.
In May 2023 alone, the BNB Chain generated earnings of $1.53M. This represents a 102% YoY growth.
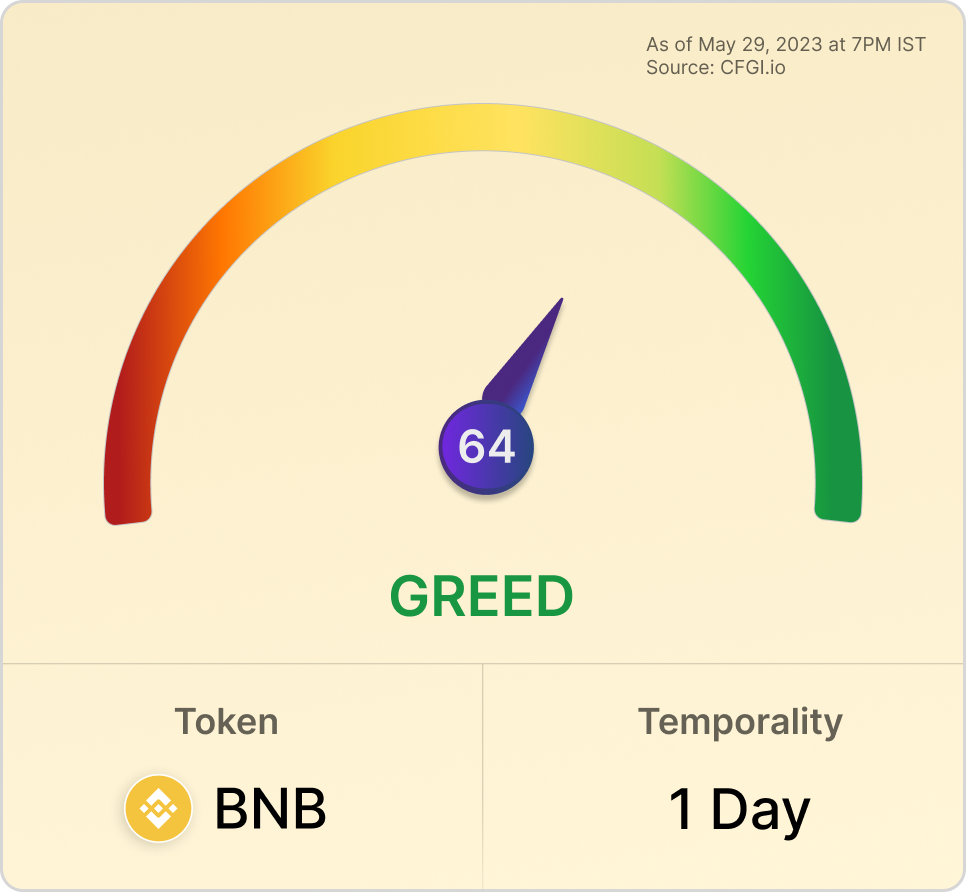
3. Community Sentiment
The BNB Fear and Greed Index arrives at the community sentiment for the BNB coin based on its social mentions, search engine queries, technical indicators, etc. Greed suggests that investors are rushing to buy BNB and you should invest only after due diligence.
4. Technical analysis
Oscillators: They are typically used to identify overbought and oversold conditions. When an oscillator is oversold, it indicates that the security is underpriced and may be due for a rally and vice versa.
Moving Averages: They help identify trends and trend reversals. When a moving average crosses above another moving average, it indicates that the trend is bullish. When a moving average crosses below another moving average, it indicates that the trend is bearish.
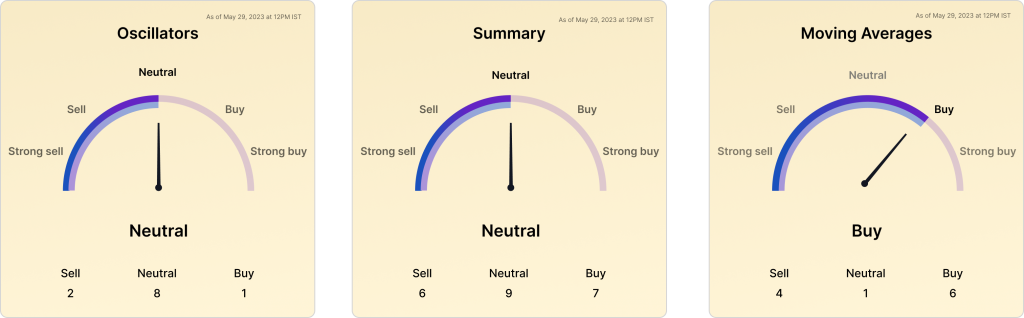
💡Oscillators suggest that BNB is in a neutral zone, while the moving averages indicator hints at a bullish trend. Both, the fundamental and technical aspects of BNB indicate that it may be a favorable investment option.
Key Highlights of the Binance Chain from Jan-March 2023
- BNB Chain experienced a rebound in its market cap, increasing by 24.9% quarter-over-quarter (QoQ).
- Ecosystem developments, such as the launch of Uniswap, new GameFi, and SocialFi applications, contributed to the growth of address and transaction activity.
- The network underwent upgrades, leading to further decentralization, with an increase in the average number of validators and total stake.
Disclaimer: None of the information in this article is intended to be financial advice, please do your own research before making any investments.