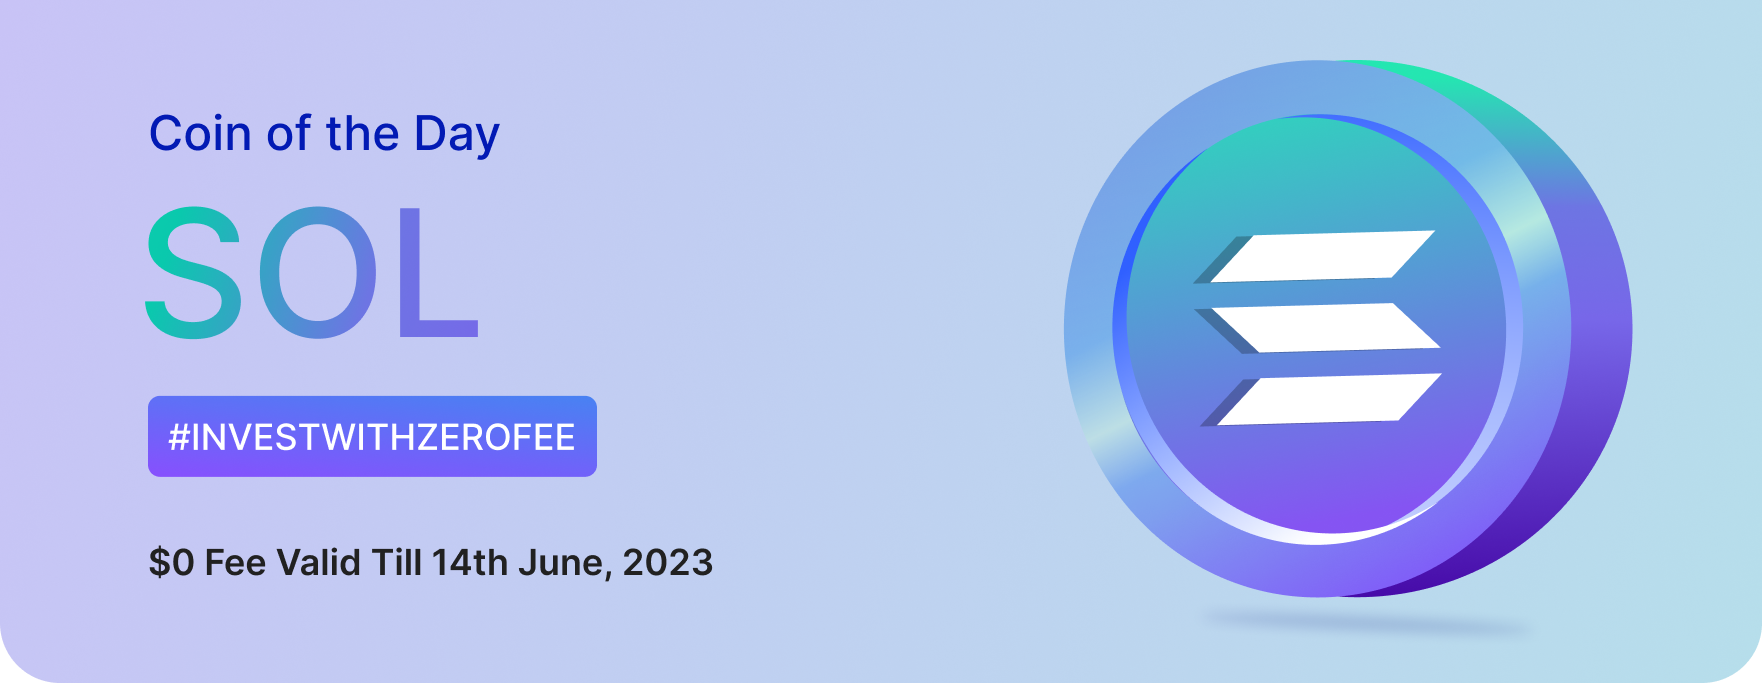
#Day 4 – Solana (SOL) Coin Of The Day Report
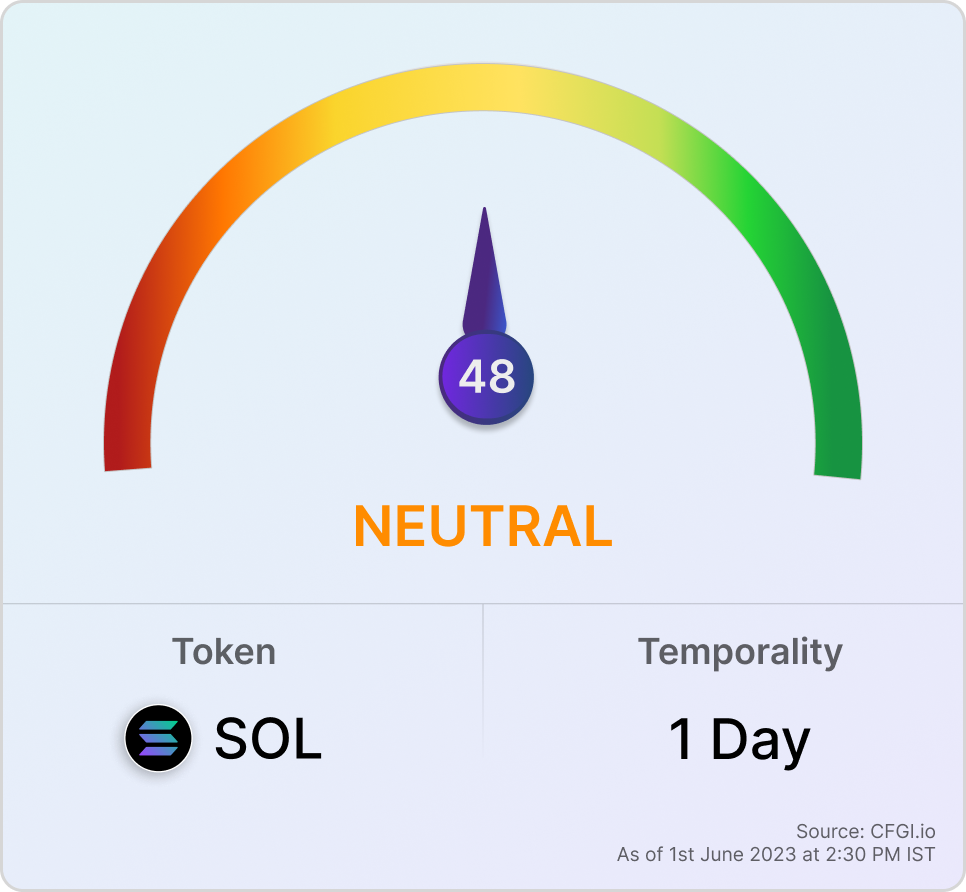
SOL Score
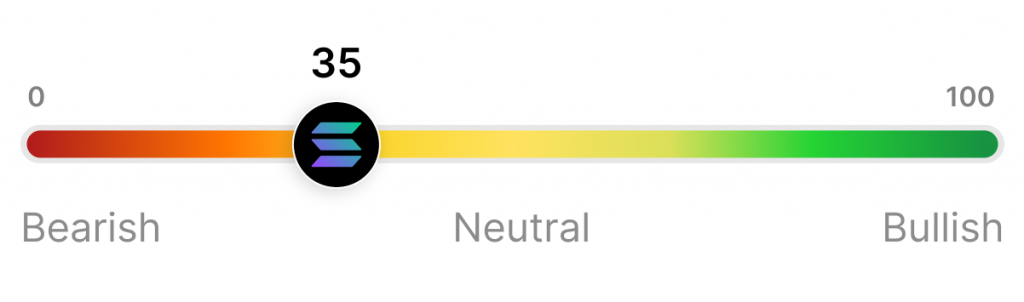
Why did we give a Neutral sentiment for SOL?
Within just a year of its launch, SOL’s market cap skyrocketed from $20 million to over $10 billion. Solana’s innovative PoH consensus mechanism and rapid transaction speed turned heads as they hosted hackathons, granted developer awards, and formed alliances with industry leaders like FTX.
However, setbacks like blockchain halts, and its affiliation with FTX have pushed Solana to the back seat. As you go through this report, it would be interesting to see what the future holds for SOL.
How Did We Arrive at This Score?
We assessed Solana across four key metrics to provide you with a comprehensive understanding of its overall well-being.
1. Price Performance ✅
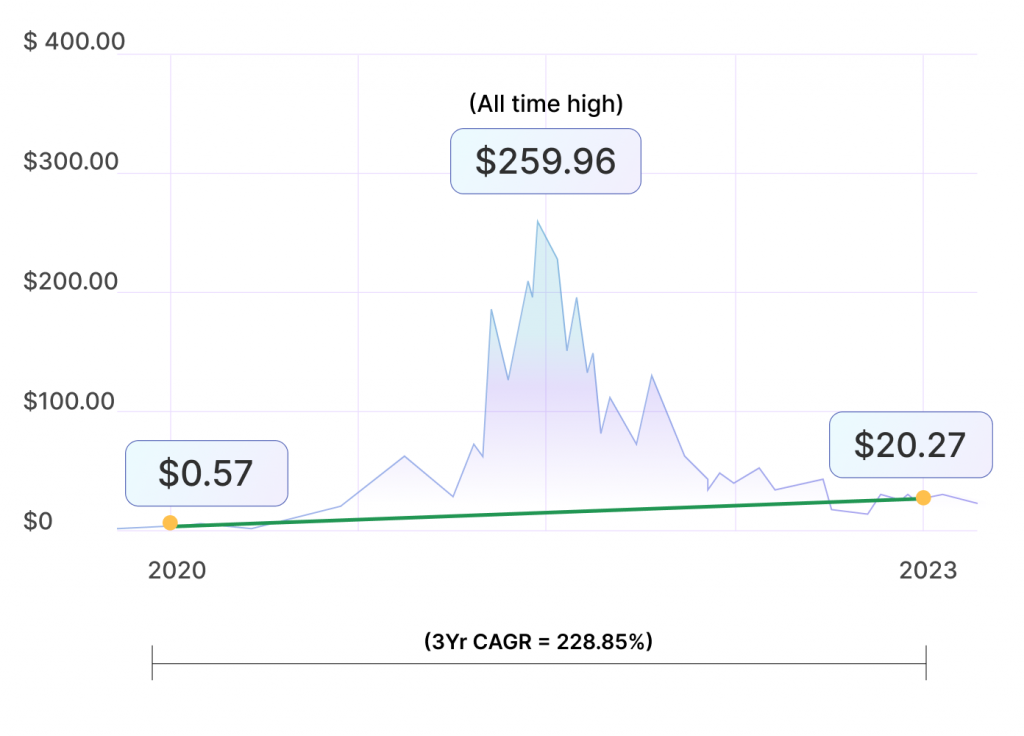
Since its introduction in 2020, Solana’s price performance has been marked by ups and downs.
It peaked at an all-time high of $260 in Nov 2021 after being launched at a price of less than a dollar. In Q1 2023, specifically, Solana’s market cap rebounded and increased 118.1% quarter-over-quarter (QoQ).
2. Fundamental Analysis ✅
In this section, we evaluate the Solana network based on critical on-chain metrics indicative of its health.
2.1. Active Addresses Count
This indicates the overall activity on the network. A growing active address count signals a growing network and impacts the price of the network token positively.
Monthly active addresses on Solana went from ~ 14.18M to around 15.24M between Jan 2021 and Jan 2023 at an annual growth rate of ~4%. The current active address count on Solana remains at 12.09M.
2.2. NVT Ratio
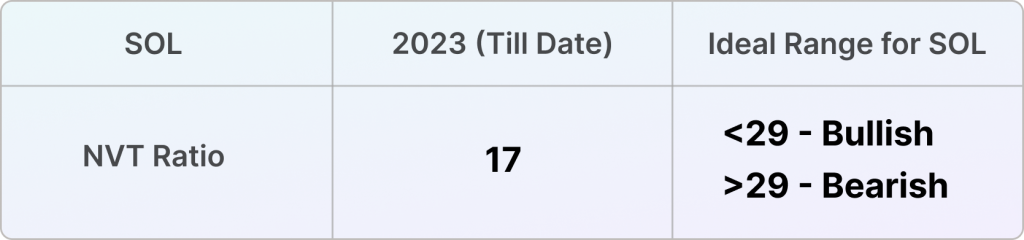
💡 The NVT ratio compares a cryptocurrency’s market cap to its transaction volume. A high ratio suggests a potential bubble since the market cap is outpacing the transaction volume. A low ratio indicates an undervalued token.
P.S. NVT ratio for each crypto varies. We talk in detail about how this ratio is calculated at the end of the email, so hang on! Remember, it’s crucial to analyze this ratio in conjunction with other indicators.
2.3. Blockchain Network Profitability
We measure this by deducting the net incentives given to network participants, like miners and validators, from the net income generated by the platform.
A major portion of Solana’s expenses can be attributed to token incentives. In May 2023, Solana was at a deficit of -44.8M after spending on token incentives.
3. Community Sentiment
The SOL Fear and Greed Index arrives at the community sentiment for the SOL coin based on its social mentions, search engine queries, technical indicators, etc. Neutral suggests that investors are neither actively buying nor selling.
4. Technical Analysis ✅
Oscillators: They suggest a buy signal when an asset is oversold, indicating that the security may be underpriced and vice versa.
Moving Averages: When a moving average crosses above another moving average, it indicates that the trend is bullish and vice versa.
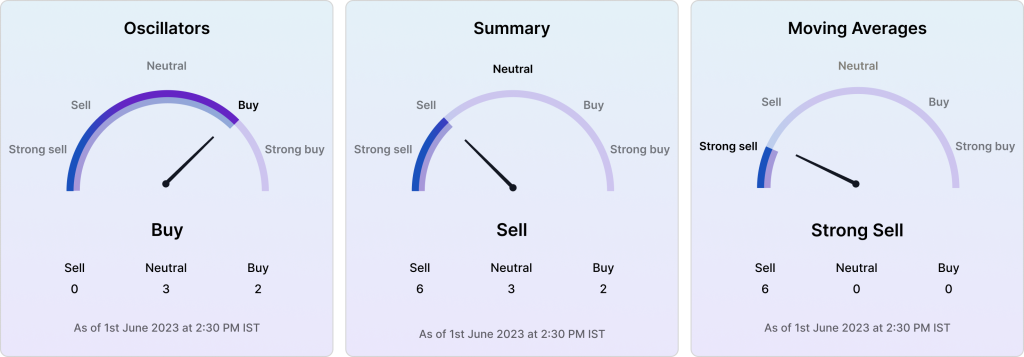
💡Technical analysis suggests that SOL is likely to experience sell pressure. However, if you believe in its fundamentals and think it can bounce back to its star-performer shape, you may invest in it.
Key Highlights
- Solana’s market cap rebounded in Q1 2023, increasing 118.1% quarter-over-quarter (QoQ), while its revenue went up 68.7% QoQ.
- Ecosystem developments, such as the BONK airdrop, several NFT collections, and dePIN applications drove up transactions on the network.
- The Solana network became more decentralized as the average number of validators increased 18.9% QoQ.
You Ask, We Answer – NVT Explained!
Many readers wrote back to us asking questions about the NVT ratio and its calculation, so here we are explaining it to you. But first off, it’s heartwarming to see such incredible interest from people to learn about cryptocurrencies.
The NVT ratio compares a cryptocurrency’s market cap to its blockchain activity. If the market cap grows much faster than the blockchain activity, it could indicate an inflated token price. On the other hand, if the market cap is lower relative to the activity, the token may be undervalued.
NVT = Market Cap/Transaction Volume
Let’s calculate the NVT ratio for SOL. As of 1st June 2023 at 07:00 PM IST, its market cap stands at $8,258,332,817 and its trading volume is $229,382,053. Putting the two in the formula would give you the NVT as 21.
It’s important to note that NVT ratios vary for each blockchain, so there’s no one-size-fits-all range. As a general guideline, if the NVT ratio is more than double the historical average, it can be seen as a bearish indicator.
To check how we arrived at the NVT ratios above in the email, refer to this sheet.
We hope this explanation clarifies the concept for you. Feel free to ask any further questions by replying to this email. We’re here to help you learn!
Disclaimer: None of the information in the email is intended to be financial advice. Please do your own research before making any investments.