In 2020, TRX garnered positive sentiment due to its strong team and clear vision, positioning itself as a promising player in the crypto space. However, lately, some investors have grown to become skeptical of TRX because of all the FUD in the market, while others are optimistic about the project’s potential.
So is TRX at a discount now, or is it just a thing of the past? Let’s find out.
#Day 8 – Tron (TRX) Coin Of The Day Report
Tron Score
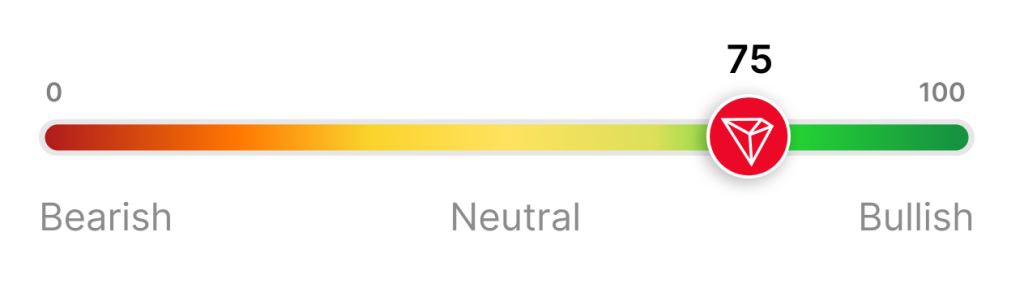
The fundamental and technical analysis of the TRX token suggests that it is in good shape.
How Did We Arrive at This Score?
When investing in a cryptocurrency, looking at some basic factors to determine whether the project is growing or dying is crucial. We did the same with Tron.
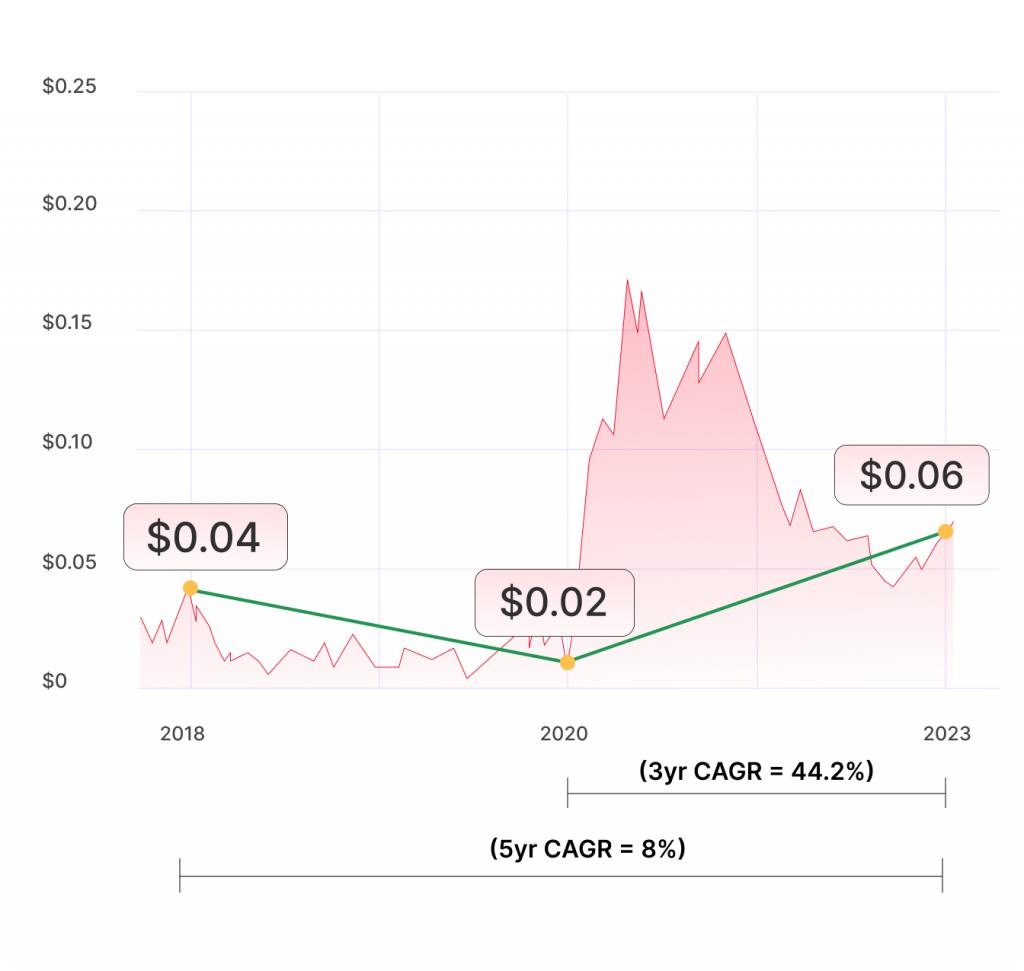
1. Price Performance ✅
While TRX has seen impressive growth in the last three years, its 5yr performance is comparatively mediocre. However, if you firmly believe in the fundamentals of the token you may explore it.
2. Fundamental Analysis ✅
Fundamental analysis is a method of evaluating a cryptocurrency’s intrinsic value, and the following on-chain metrics help you do that.
2.1. Active Addresses Count
Active address count indicates the overall activity on the network. A growing active address count signals a growing network and positively impacts the network token’s price.
Monthly active addresses on Tron went from ~ 4.8M to around 15M between Oct 2020 to May 2023 at an annual growth rate of ~46%.
2.2. NVT Ratio
💡The NVT ratio compares a cryptocurrency’s market cap to its transaction volume. A high ratio suggests a potential bubble since the market cap is outpacing the transaction volume. A low ratio indicates an undervalued token.
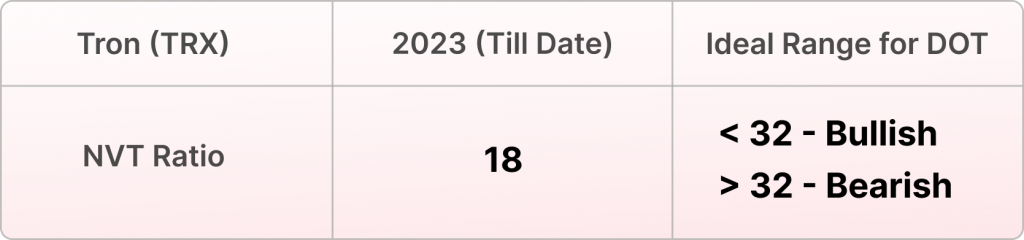
P.S. The NVT ratio for each crypto varies. Remember that this ratio shouldn’t be looked at in isolation and must always be combined with other indicators.
2.3. Blockchain Network Profitability
We measure this by deducting the net incentives given to network participants from the net income generated by the platform.
In May 2023, Tron made a net revenue of $28.4M. This represents a ~327% YoY growth.
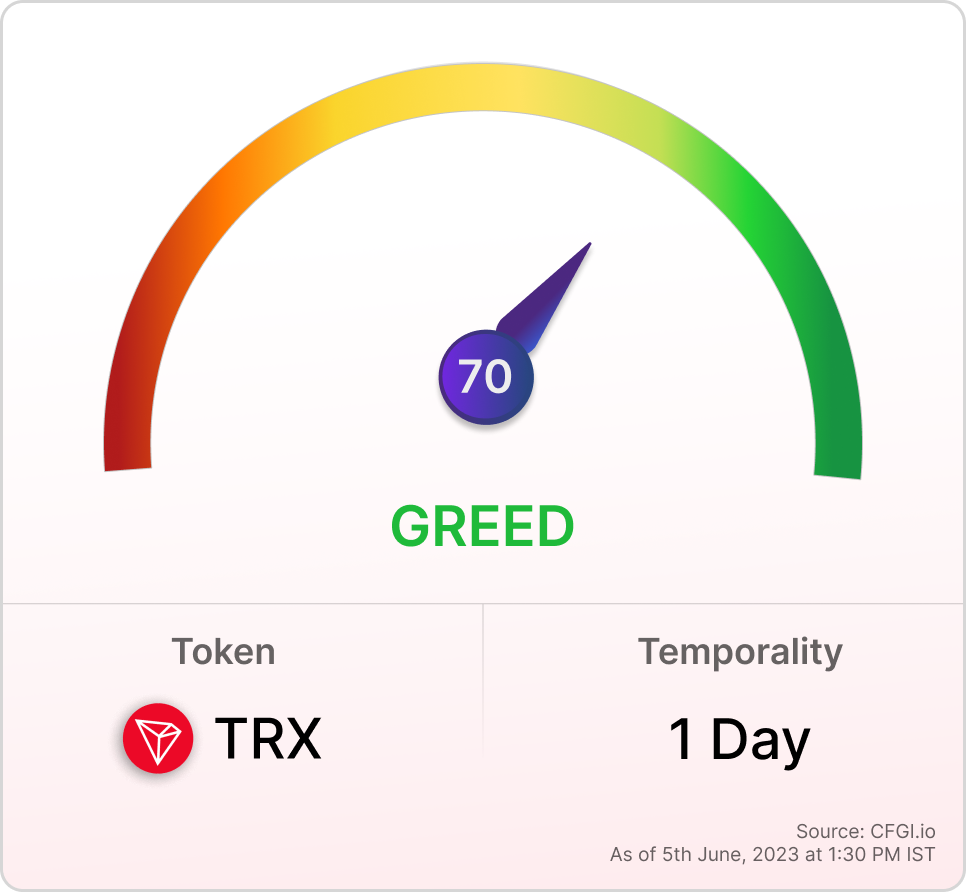
3. Community Sentiment
The TRX Fear and Greed Index analyzes social mentions, search engine queries, and technical indicators to gauge community sentiment. Greed suggests that people are actively accumulating TRX.
4. Technical Analysis ✅
Oscillators: They suggest a buy signal when an asset is oversold, indicating that the security may be underpriced and vice versa.
Moving Averages: When a short-term moving average crosses above a long-term moving average indicator, it suggests that the trend is bullish and vice versa.
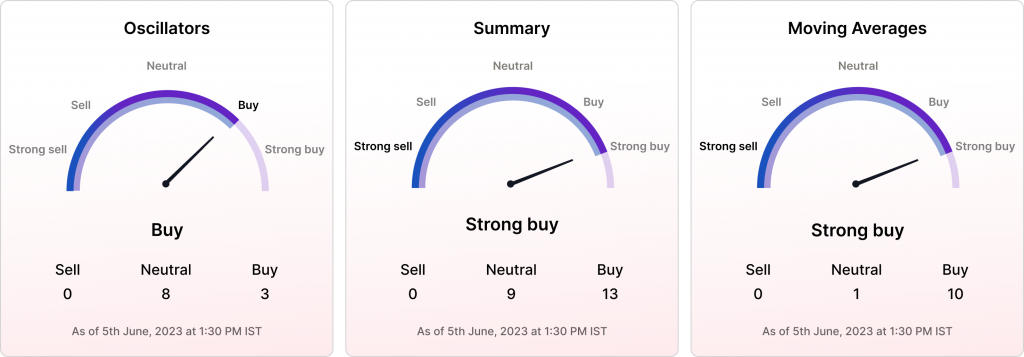
💡Oscillators indicate that TRX may be oversold, and moving averages suggest active buying of the token.
Key Highlights
1. TRX’s market cap rebounded in Q1 2023, surging 18.8% quarter-over-quarter (QoQ). Simultaneously, daily average transactions on the network grew by 7.7%.
2. Ecosystem developments like the initiation of liquid staking and a decentralized resource marketplace saw Tron’s revenue growing 88% QoQ.
3. The market cap of stablecoins on Tron jumped to $43B from $33B in Q4 2022. Its USDT market cap alone soared by 30% QoQ after Tether swapped $400M USDT from Ethereum to Tron.
4. TVL on Tron got a boost of ~19%, with its top protocols by TVL, JustLend, and JustStables, going up by 26% and 21%, respectively.
Disclaimer: None of the information in the email is intended to be financial advice. Please do your own research before making any investments.