SMH ETF Price Prediction: Where Could the VanEck Semiconductor ETF Go by 2030?
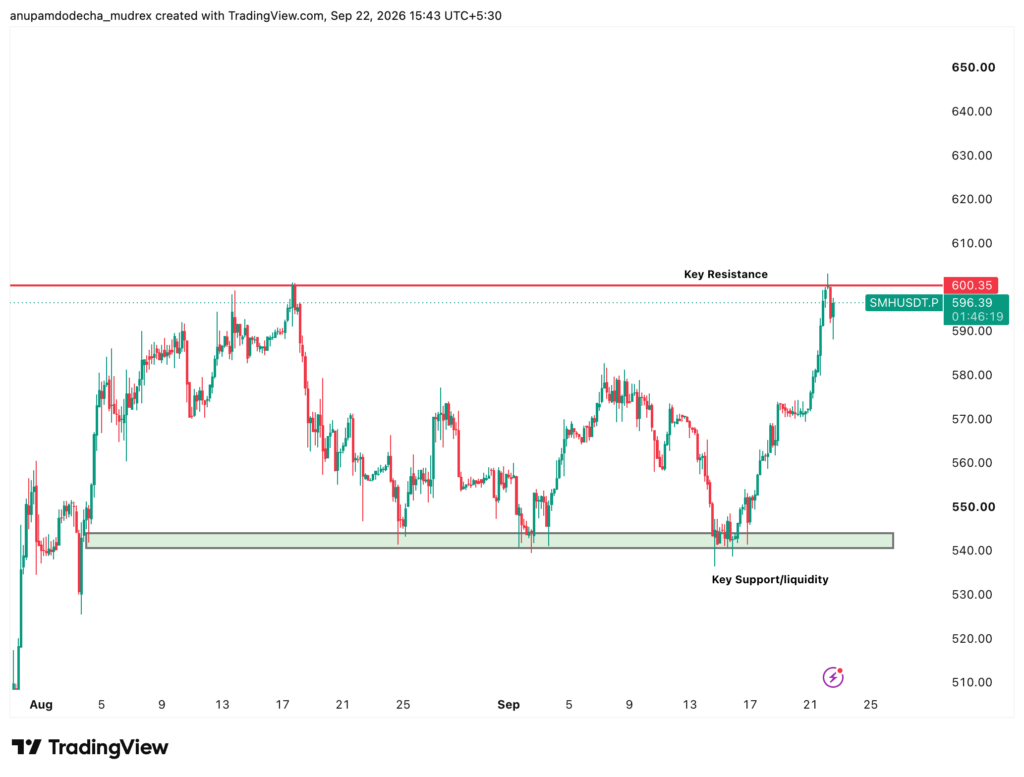
The SMH ETF price prediction for the years ahead is really one question in disguise: does the AI chip cycle keep running, or has it stagnated? SMH is the VanEck Semiconductor ETF, the most liquid way to own the entire semiconductor complex in a single ticker, and it is dominated by Nvidia. After a roughly 85% gain over the past year and a sharp mid-September pullback, the ETF ripped back above $596 in one session, leaving investors asking where this SMH ETF price prediction goes from here.
This VanEck Semiconductor ETF stock forecast breaks down where SMH could realistically go through 2026, 2027 and 2030. Because an ETF has no earnings and no single analyst price target, the SMH ETF price prediction is a look-through: it depends on Nvidia’s guide, TSMC’s capacity, memory pricing and whether hyperscaler AI spending keeps accelerating.
Below you get the full picture, including what SMH actually owns, the VanEck Semiconductor ETF bull case, the bear case, technical support and resistance levels, and whether SMH is overvalued at current prices.
Where the SMH ETF Stands Right Now
Before any SMH ETF price prediction, anchor to the numbers.
As of the close on 21 September 2026, SMH traded near $596 to $599, up more than 4% on the day. Assets under management sit around $72 to $77 billion, with a low expense ratio of 0.35%. The 52-week range runs from roughly $314 to $672, which tells you almost everything about the year this fund has had. The weighted P/E of the basket is about 37 to 38x. This is not an income product; the 30-day SEC yield is a token 0.16%, paid annually.
The ETF tracks the MVIS US Listed Semiconductor 25 Index, holding about 26 names. The top 10 make up roughly 72% of the fund, so concentration is the product, not a bug.
Here is the SMH ETF snapshot at a glance:
Metric
Value
Recent price
$596 – $599
AUM
$72 – $77 billion
Expense ratio
0.35%
52-week range
$314 – $672
Weighted P/E
37 – 38x
Beta
1.8 (high)
Top-10 concentration
72%
Largest holding
NVDA (22.5%)
SMH ETF snapshot
What SMH Actually Owns
You cannot build an SMH ETF price prediction without knowing its top holdings, because a handful of names drive the entire fund.
Weight (approx.)
Holding
Role
22.5%
Nvidia (NVDA)
GPUs, data-center AI anchor
9.8%
TSMC (TSM)
Leading-edge foundry
5.9%
AMD
GPUs and CPUs, second source
5.7%
Broadcom (AVGO)
Custom ASICs, networking
5.5%
Micron (MU)
HBM and DRAM memory
5.0%
ASML
EUV lithography monopoly
4.5%
Intel (INTC)
Foundry option, more volatile
SMH ETF Holdings
The rest of the basket includes Qualcomm, Marvell, Analog Devices, Texas Instruments, plus the wafer-fab equipment names Lam Research, Applied Materials and KLAC, and EDA leaders Cadence and Synopsys. Geographically it is about 82% US, 10% Taiwan and 6 to 8% Europe.
Concentration risk is the key point. A 10% Nvidia day is roughly a 2% SMH day before anything else moves. In practice, SMH is Nvidia plus a satellite portfolio of the AI supply chain, and that is what makes any SMH ETF price prediction so sensitive to a single stock.
SMH ETF Price Prediction 2026
So where could SMH be by the end of 2026?
There is no formal consensus target for an ETF the way there is for a single stock. What exists is a look-through to the holdings, plus occasional tactical notes (one mid-year note floated a $717 scenario, which is a scenario rather than consensus). Morningstar rates the fund Neutral.
For a base case into year-end 2026, a reasonable SMH ETF price prediction range is $560 to $672, with the upper bound being the summer high. Getting there requires the AI capex story to stay intact: another Nvidia beat and guide, TSMC holding or raising capex, and memory prices staying firm. The demand function behind SMH is extreme hyperscaler spending, with Amazon near $220 billion, Microsoft around $175 billion and Google in a similar range.
The nearest fundamental checkpoints are the quarterly prints from the top holdings, especially Nvidia’s data-center guide and Micron’s HBM pricing commentary, both of which move SMH more than any ETF-level headline.
SMH ETF Price Prediction 2027
Push the clock out a year and the story stays tied to the capex cycle.
By 2027, the bull look-through is compelling: TSMC’s advanced-node and CoWoS packaging capacity is described as sold out into 2027, HBM memory demand is called tight for years, and wafer-fab equipment spending keeps getting revised higher. Bank of America has framed the semiconductor market growing from about $1.7 trillion toward $3.2 trillion by 2030, with equipment spending rising from roughly $156 billion to $360 billion.
If that holds, an SMH ETF price prediction that reclaims and exceeds the old high toward the $700s becomes defensible. The bear path is a rollover in hyperscaler capex growth, Nvidia’s supply finally catching demand, or memory prices cracking, any of which would hit the largest weights hardest.
Your 2027 VanEck Semiconductor ETF stock forecast, in plain terms: the cycle looks durable on paper, but SMH’s concentration means a few names decide the outcome.
By 2030, the VanEck Semiconductor ETF long-term stock forecast leans on whether semiconductors remain a secular growth story rather than a boom-bust cycle. The long-cycle research from Bank of America and others points to a semiconductor total addressable market still compounding into 2030, with memory becoming the largest slice of demand in some frameworks.
The structural pillars behind a bullish SMH ETF price prediction are AI compute demand, the shift to advanced packaging and High-NA lithography (ASML’s roadmap with TSMC and Samsung stretches to 2028 to 2030 and beyond), and the wafer-fab equipment names that benefit from both logic and memory buildouts. These are multi-year investment cycles, not single-quarter events.
If AI infrastructure spending stays elevated and the chip TAM compounds as projected, a 2030 SMH ETF price prediction well above today’s levels is plausible under a healthy-execution scenario. The counterweight is history: when capex peaked in 2022, SMH gave back a year of gains in weeks. This is a high-beta basket that moves hard in both directions.
The Bull Case vs the Bear Case for SMH
Every honest SMH ETF price prediction shows both sides.
Bull case for the VanEck Semiconductor ETF:
Another Nvidia beat and guide, with data-center supply tight into FY28
TSMC raising capex and advanced packaging staying sold out
HBM and memory prices staying bid, lifting Micron
ASML bookings and rising wafer-fab equipment spend
Continued ETF inflows, which are themselves a demand source for the underlying names
Any “AI capex not peaking” print from Microsoft, Amazon, Google or Meta
Bear case for the VanEck Semiconductor ETF:
Hyperscaler capex growth rolling over, the classic cycle-peak signal
Nvidia supply finally catching demand
Memory prices cracking after the 2026 run
China export-control headlines hitting the supply chain
A sharp rates or dollar shock, since semis are long-duration risk assets
An Intel-sized single-name air pocket dragging the fund
Is SMH Overvalued? A Quick Valuation Check
At about 37 to 38x weighted earnings, SMH is not cheap. You are paying up for the assumption that AI, HBM memory, foundry and equipment spending remain a multi-year cycle, and that assumption sits at the heart of any SMH ETF price prediction.
The bull view is that if that assumption is right, the summer high near $672 is just a rest stop on a longer climb. The bear view is that a rich multiple on a cyclical, concentrated basket leaves little cushion if capex peaks. So is SMH overvalued? It is priced for the cycle continuing, not for it ending.
Technical Analysis: Support and Resistance Levels
For traders, the chart tells its own version of the SMH ETF price prediction.
Price sits above both the 50-day moving average (around $564) and the 200-day (around $488), so the larger trend is up. RSI near 61 after the 4% jump is firm but not a blow-off, and the MACD histogram is turning up from a summer washout. The move looks like a rebound inside a larger uptrend rather than a new runaway leg.
Zone
Level
Role
Immediate resistance
$599 – $609
Recent high, next shelf
Major resistance
$660 – $672
Summer / 52-week high
Immediate support
$565 – $578
20/50-day cluster
Next support
$533 – $538
Mid-September base
Deeper support
$504, then $488
200-day, trend line
Crash shelf
$314
Only if the AI-capex narrative breaks
SMH ETF Technical Levels
A hold of $565 and a close above $609 opens a run at the $660 to $672 highs. Losing $565, then $538, points down toward the 200-day near $488, which is the “cycle still intact” line.
How Investors in India Can Buy SMH Shares
You do not need a US bank account to own the semiconductor complex.
Indian investors can buy SMH directly on Mudrex using INR, with fractional shares (tokenised) so you can start small instead of paying for a full unit. That means you can own a slice of the entire chip supply chain, from Nvidia to TSMC to ASML, with the money you already have, in the currency you already use.
What is the SMH ETF price prediction for 2026? There is no formal ETF price target, but a look-through to the holdings suggests a reasonable SMH ETF price prediction range of $560 to $672 for year-end 2026, driven by AI chip demand, Nvidia’s guide and memory pricing. The summer high near $672 is the key upside marker.
What is the latest analyst price target for SMH? ETFs do not carry a single consensus target like stocks do. Morningstar rates SMH Neutral, and one tactical note floated a $717 scenario. The more useful signal is the price-target trend for top holdings like Nvidia, TSMC and Micron.
Is the VanEck Semiconductor ETF a good long-term investment? SMH offers concentrated exposure to the semiconductor cycle in one low-cost ticker. The upside is the multi-year AI and chip TAM growth story; the main risk is high concentration in Nvidia and the cyclical, volatile nature of the sector. This is not investment advice.
What could make SMH rise? Key catalysts in any bullish SMH ETF price prediction include another Nvidia beat and guide, TSMC raising capex, firm HBM memory prices, rising equipment spending and continued ETF inflows, plus any sign that hyperscaler AI capex is still accelerating.
What are the biggest risks for the VanEck Semiconductor ETF? The main risks are a rollover in hyperscaler capex, Nvidia supply catching demand, memory prices cracking, China export-control headlines, a rates or dollar shock, and heavy single-name concentration.
Is SMH overvalued or undervalued? At about 37 to 38x weighted earnings, SMH is priced for the AI and chip cycle continuing for years. Bulls see the old high as a rest stop; bears note the rich multiple offers little cushion if capex peaks.
Can the VanEck Semiconductor ETF reach a new all-time high? Yes, a move above the roughly $672 summer high would set a new record. Any SMH ETF price prediction that hits a new high likely requires the top holdings, especially Nvidia and the memory names, to keep beating and guiding higher.
Conclusion
The SMH ETF price prediction through 2030 comes down to a single variable: whether AI-driven semiconductor spending keeps compounding or rolls over. The basket owns the best names in the cycle, led by Nvidia, TSMC and Micron, and the long-term chip TAM story remains intact in most Street research. The catch is concentration and valuation: a rich multiple on a fund where a few names decide everything means SMH moves hard in both directions.
Anupam has over 3 years of experience in the crypto industry, having worked with top indian crypto exchanges. He writes about Bitcoin, altcoins, AI, and emerging tech, helping readers understand what’s driving markets and where the digital asset ecosystem is headed.