
Price action trading helps traders understand market movements without depending heavily on technical indicators. However, reading candlestick charts and identifying trends can be difficult for beginners. A single price movement does not always signal a buying or selling opportunity.
This guide explains how price action trading works, the strategies beginners can learn, and how to apply them in cryptocurrency markets.

Price action trading is a method of analysing an asset’s price movements to identify potential market opportunities. It focuses on raw price data rather than relying mainly on technical indicators.
Traders study candlestick charts, market structure, swing highs, swing lows, and support and resistance levels. These elements help them understand whether buyers or sellers are controlling the market.
For example, when Bitcoin repeatedly forms higher highs and higher lows, it may indicate an upward trend. Conversely, lower highs and lower lows may suggest a downward trend.
Price action analysis can also include trading volume and volatility. These factors help traders assess whether a price movement has enough market participation to continue.
Price action trading works by identifying patterns and important levels on a price chart. Traders use these observations to assess market direction and plan potential entries and exits.
A candlestick chart is one of the most common tools used for this purpose. Each candle represents four important values:
Together, these values are known as OHLC data. The candle body shows the opening and closing prices, while the upper and lower wicks extend towards the period’s high and low prices.
Traders also examine volume, which measures how much of an asset was traded during a specific period. Higher trading volume on the exchange being analysed may indicate stronger participation during a breakout, although it does not guarantee that the breakout will hold.
Another useful metric is Average True Range (ATR), which measures market volatility. A rising ATR suggests larger price movements, while a falling ATR suggests smaller price movements. ATR does not indicate whether the market is moving up or down.
Price action patterns help traders identify possible changes in market direction or trend continuation. Beginners can start with a few commonly observed patterns.
A bullish engulfing pattern forms when a bullish candle’s body covers the previous bearish candle’s body. It may indicate increasing buying pressure.
A bearish engulfing pattern forms when a bearish candle’s body covers the previous bullish candle’s body. It may suggest growing selling pressure.

A hammer has a small body near the upper end of the candle and a long lower wick. It may indicate rejection of lower prices, particularly when it appears after a decline.
A shooting star has a small body near the lower end of the candle and a long upper wick. It may indicate selling pressure when it appears after an upward move.

A doji forms when the opening and closing prices are nearly equal. It suggests indecision between buyers and sellers. Its meaning depends on the surrounding price action and the market trend.

These patterns are not guaranteed reversal signals. Their significance depends on the broader trend, trading volume and the price level where they appear. Traders can refer to our candlestick patterns guide for more examples.
Support and resistance help traders identify important price zones where buying or selling pressure may increase.
Support is a price area where buying interest may slow or stop a downward movement.
Resistance is a price area where selling interest may slow or stop an upward movement.
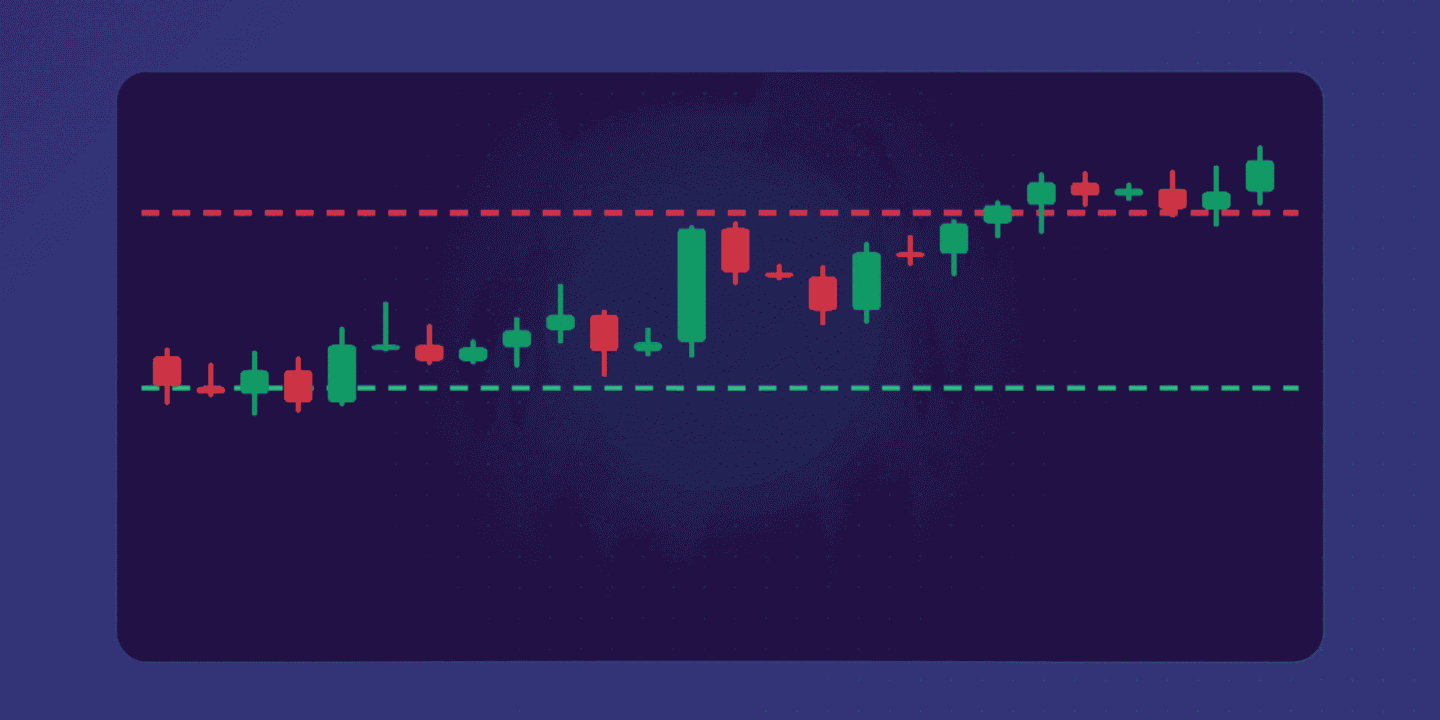
For example, if Bitcoin repeatedly rebounds near a particular price, traders may identify that area as support. If it repeatedly struggles to move above another price, that area may act as resistance.
Traders also use trendlines to connect successive swing lows in an uptrend or swing highs in a downtrend. These lines help visualise the direction of a trend.
When price breaks above resistance, the level may become support. Similarly, broken support may become resistance. However, traders often wait for a candle close or a successful retest to avoid acting on false breakouts. Support and resistance are better treated as zones than exact price points.
Range trading involves identifying price zones where an asset has repeatedly reversed or consolidated. Traders may look for buying opportunities near support and selling opportunities near resistance. However, they should watch for breakouts that could invalidate the range
Beginners can learn price action trading by following a structured approach rather than relying on individual candlestick signals.
Here are five steps to get started:
Step 1 – Choose a chart: Start with a candlestick chart to understand OHLC data and price movements.
Step 2 – Identify the trend: Look for higher highs and higher lows or lower highs and lower lows.
Step 3 – Mark key levels: Identify support, resistance, previous swing highs, and swing lows.
Step 4 – Wait for confirmation: Look for a breakout, pullback, or relevant candlestick pattern before considering an entry.
Step 5 – Plan the trade: Decide your entry price, stop-loss level, and take-profit target before placing an order.
Timeframes also matter. Shorter charts may show more trading opportunities but can contain greater market noise. Higher timeframes often provide a broader view of market structure.
| Trading style | Common timeframes |
|---|---|
| Scalping | 1-minute to 5-minute |
| Intraday trading | 15-minute to 1-hour |
| Swing trading | 4-hour to daily |
| Position trading | Daily to weekly |
These are common examples, not fixed rules. Traders should choose timeframes based on their trading approach and risk tolerance.
Risk management is essential because even well-planned price action setups can fail.
Traders should consider the following factors:
For example, if a trader risks ₹100 to target ₹200, the potential risk-reward ratio is 1:2. This is an illustrative example, not a recommended target or expected outcome.
Price action trading and indicator-based trading use different approaches to analyse markets. However, traders can combine both methods.
| Parameter | Price action trading | Indicator-based trading |
|---|---|---|
| Main focus | Raw price movements | Calculated market data |
| Tools | Candlesticks, trendlines, support and resistance | RSI, MACD, moving averages |
| Signals | Patterns and price structure | Indicator readings and crossovers |
| Market interpretation | Often requires manual analysis | Uses mathematical calculations |
| Learning curve | Requires chart-reading practice | Requires understanding indicator settings |
Price action trading offers a direct view of market behaviour, while indicators can help simplify certain patterns. Neither approach guarantees accurate predictions.
Price action trading provides a structured way to understand market behaviour through candlestick patterns, support and resistance, and market structure. Beginners can start with trend trading, breakout setups and pullback strategies before exploring more advanced techniques.
In crypto markets, price movements can be sharp and unpredictable. Traders should combine price action analysis with volume, volatility checks and disciplined risk management.
At Mudrex, you can explore crypto futures with INR margin and track your profit and loss in rupees. If you want to apply your chart-reading skills, explore our crypto trading platform in India, review the available contracts and fees, and understand the risks before getting started.
To build stronger conviction in crypto investing, explore in-depth guides on Mudrex Learn and subscribe to the Mudrex YouTube channel for insights on markets, tokens, and long-term crypto trends.
Price action trading is a method of analysing an asset’s price movements to identify potential trading opportunities. It uses candlesticks, support and resistance, and market structure rather than depending mainly on indicators.
It works by studying historical and current price movements to identify trends, reversals, and breakouts. Traders use these observations to plan potential entries, exits, and stop-loss levels.
Beginners can start by studying candlestick charts, identifying market trends, and marking support and resistance zones. Practicing on historical charts or a demo environment can help build confidence.
Traders commonly use 5-minute, 15-minute, 1-hour, 4-hour, daily, and weekly charts. The right timeframe depends on whether they prefer scalping, intraday, or swing trading.
Yes, traders use price action analysis in crypto markets to study trends, breakouts, reversals, and support and resistance. However, high volatility and sudden liquidity changes can cause patterns to fail.
Price action focuses on raw price movements and chart patterns, while indicator-based trading uses mathematical calculations such as RSI and MACD. Traders may combine both approaches.
Support and resistance identify price zones where buying or selling pressure may increase. Traders use these levels to identify potential reversals, breakouts, and entry or exit opportunities.
Price action trading and cryptocurrency futures involve market risks, including the possible loss of invested capital. Futures trading involves leverage, which can magnify both gains and losses and may lead to liquidation. All examples in this article are illustrative and intended for educational purposes only. They should not be considered financial or investment advice. Conduct your own research (DYOR) and consult a qualified financial adviser before making trading decisions.