
Crypto prices move quickly. Sometimes, they move far beyond their usual trading range. But these movements may not last too long. In many such cases, the prices move back to their average. This behaviour is used by reversion trading to identify potential entry and exit points. Traders use indicators such as RSI, Bollinger Bands, and Moving Averages to spot these price movements and identify possible trading opportunities.
This blog helps you learn what mean reversion trading is, how it works, and which indicators traders use to identify potential price reversals. You will also understand how to apply mean reversion strategies in crypto markets.

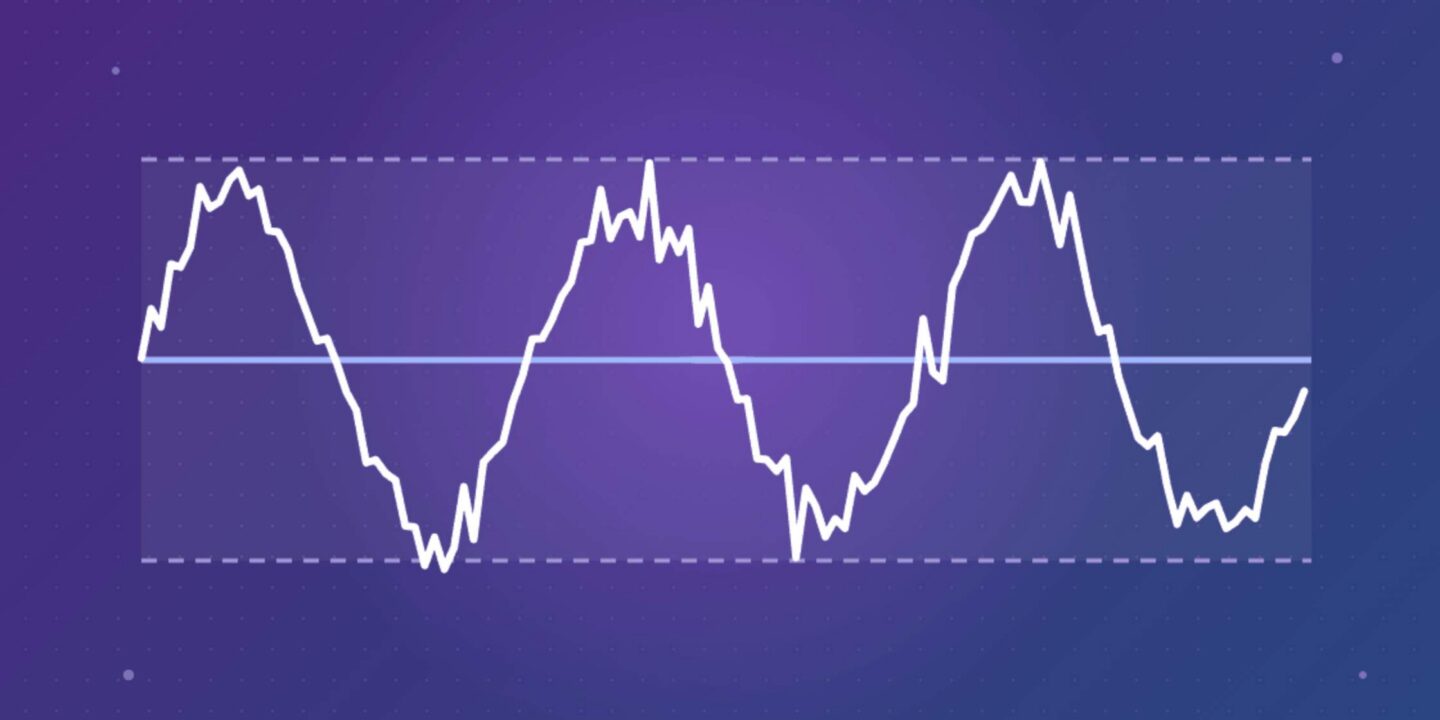
Notably, mean reversion trading is a strategy based on the idea that an asset’s price tends to move back towards its average after rising or falling sharply. This average could be calculated using historical prices over a specific period.
To understand this more clearly, this example could be useful. Suppose Bitcoin usually trades around $100k. If its price suddenly rises to $110,000, traders may consider it overextended. Similarly, if it drops to $90,000, they may look for signs that it is undervalued relative to its recent average.

Despite these price movements in both cases, traders expect the price to move closer to its average again. But this is not necessary to happen always. As market conditions continue to change, prices will also change accordingly.
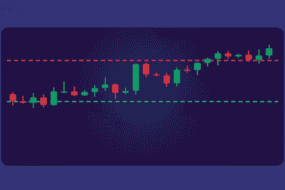
Mean reversion trading is commonly used in range-bound markets, where prices move between support and resistance levels. Traders use technical indicators to measure price deviations and identify possible entry and exit points.
The mean reversion strategy works by identifying when an asset’s price moves too far away from its average. Traders usually follow these steps for a mean reversion strategy.
A mean reversion strategy works by identifying when an asset’s price moves too far away from its average. Traders then look for signs that the price may move back towards this average.
For example, when Bitcoin trades well above its average price, traders may expect a downward correction. Similarly, when the price falls significantly below its average, they may look for a possible upward movement.
Traders generally follow these steps when using a mean reversion trading strategy:
There are many technical indicators that you can use to assess an asset’s price moves. These indicators help you identify overbought or oversold conditions and possible price reversals. Some indicators include:
The Relative Strength Index (RSI) is a measurement of the speed and strength of the recent price moves. It identifies whether an asset is overbought or oversold.
Usually, RSI moves between 0 and 100. Readings above 70 are often considered overbought, and below 30 are oversold. These levels show that the price could move back towards its average. But this doesn’t confirm a reversal. You should wait for other signals also before entering into a trade.
Bollinger Bands are volatility indicators. They show how far the price could move from its moving averages. The indicator consists of three lines, which include an upper band, a middle band, and a lower band.
Notably, when the price touches or moves above the upper band, it indicates that the asset is overbought or trading above its usual range. It could also signal a possible downward price correction. But when the price touches or moves below the lower band, it is an indication of a potential upward reversal.

Moving Averages (MA) help you calculate the average price of an asset over a selected period. Thus, traders will be able to understand the asset’s usual price level and its deviation from it.
In detail, traders may use a 20-day or 50-day moving average to track the average price. if the current price moves far above or below this line, they may watch for a possible return towards the average.
Volume Weighted Average Price (VWAP) calculates an asset’s average trading price. The calculation is based on both price and trading volume. It gives more weight to prices where more trading activity takes place.
VWAP helps you know whether an asset is trading above or below its average price. When the price moves far away from VWAP, traders may watch for a possible return towards it. The indicator is used for intraday trading. It resets at the beginning of each trading session, making it useful for tracking short-term price movements.
You can use mean reversion trading in crypto by identifying price deviations and waiting for signs of a possible reversal. The strategy allows you to find potential entry and exit points when crypto prices move away from their usual averages.
These are the steps you can use for a crypto mean reversion strategy:
1. Choose a trading pair: Select a cryptocurrency such as Bitcoin or Ethereum. Check its recent price history and trading volume before starting.
2. Identify the average price: Use indicators such as Moving Averages or VWAP to calculate the asset’s average price over a selected period.
3. Check price deviations: Observe whether the current price has moved significantly above or below its average. Bollinger Bands can help you identify these movements.
4. Confirm reversal signals: Use RSI to check whether the asset is overbought or oversold. Wait for signs that the price may start moving towards its average.
5. Enter the trade: Consider a long position when the price is below its average and shows signs of recovery. Similarly, consider a short position when the price is above its average and shows signs of weakening.
6. Set stop-loss and exit levels: Decide where to exit if the trade moves against you. You can also use the moving average as a potential profit target.
Remember that crypto markets can remain overbought or oversold for long periods. Do not enter a trade based on a single indicator. Look for confirmation and manage your risk before taking a position.
Mean reversion trading works best in range-bound markets, where prices move between established support and resistance levels. During these periods, prices often return towards their average after short-term movements.
Traders can use this strategy when:
However, mean reversion trading may not work well during strong market trends. For example, positive news or major market events can push Bitcoin prices higher for an extended period. In such cases, the price may not return to its previous average.

Despite the benefits, mean reversion trading holds some risks too. Some of the risks include:
The mean reversion strategy assists crypto traders in finding opportunities where prices deviate from their average. Various technical indicators like RSI, Bollinger Bands, Moving Average, and VWAP will assist crypto traders to determine whether there is any deviation in prices and their reversions.
Prices are not always expected to revert to their historical average levels. There are various factors that can influence the effectiveness of this strategy, including strong market trends and unexpected market events. Therefore, traders need to verify signals, set appropriate stop-loss orders, and trade at appropriate position sizes.
To build stronger conviction in crypto investing, explore in-depth guides on Mudrex Learn and subscribe to the Mudrex YouTube channel for insights on markets, tokens, and long-term crypto trends.
Mean reversion trading is a strategy based on the idea that an asset’s price may return to its historical average after moving significantly higher or lower.
A mean reversion strategy identifies when an asset’s price moves far above or below its average.
Common indicators include the Relative Strength Index (RSI), Bollinger Bands, Moving Averages, and Volume Weighted Average Price (VWAP).
Mean reversion generally works best in range-bound markets, where prices move between established support and resistance levels.
Mean reversion trading looks for opportunities when prices move back towards their average. Trend following focuses on trading in the direction of an existing price trend.
Yes. Traders can use mean reversion strategies in crypto futures to identify potential long and short opportunities when prices move away from their averages.
The main risks include strong market trends, false reversal signals, sudden volatility, and inaccurate average levels. Poor risk management can also increase losses.
Cryptocurrency trading involves market risks and may result in financial losses. Mean reversion strategies do not guarantee profits, as prices may continue moving away from their historical averages. The examples in this article are for educational purposes only and do not constitute financial advice. Always do your own research (DYOR) and consult a qualified financial advisor before making trading decisions.