
M pattern trading helps traders identify a possible shift from an uptrend to a downtrend. However, two price peaks do not always signal a market reversal. Entering too early can expose traders to false signals and unexpected price movements.
Understanding the M chart pattern, its neckline, breakout confirmation, and trading volume can help traders plan better entries and exits. This guide explains how the pattern works, how to trade it, and how to manage risk in crypto markets.

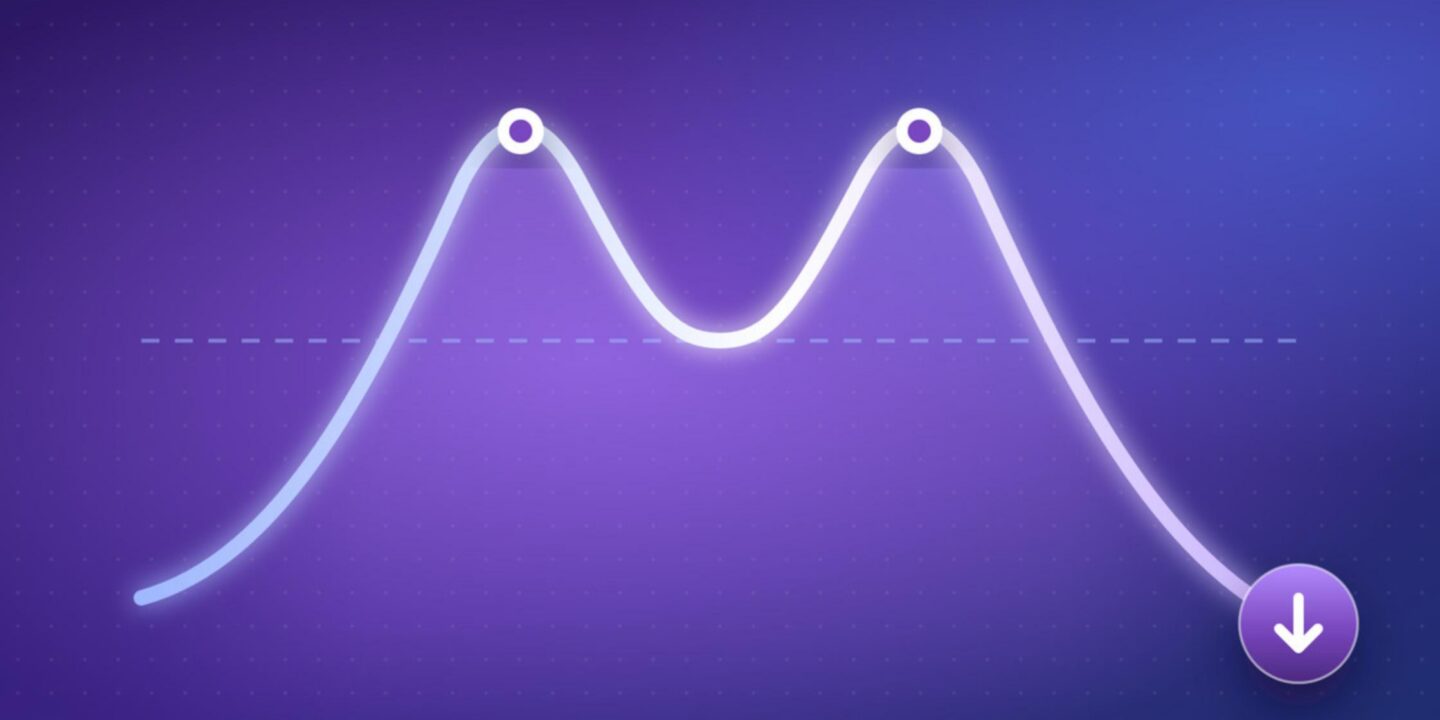
The M pattern in trading is a bearish reversal chart formation that appears after an upward price movement. It consists of two peaks at approximately the same price level, separated by a decline.
The pattern resembles the letter M on a candlestick or line chart. It suggests that buyers have struggled to push prices above a particular resistance level twice. This may indicate weakening buying pressure and a possible shift towards selling.
The M pattern is also known as the double-top pattern. Traders use it to identify potential bearish reversals in stocks, forex, commodities and cryptocurrencies.
The neckline is the support level connecting the lowest point between the two peaks. A break below this level confirms the bearish pattern.
TradingView explains that a double-top pattern is considered complete when the price closes below the neckline, which connects the intermediate low between the two peaks.
You can identify the M pattern by looking for two similar price peaks after an upward trend, with a visible trough between them. Learning how to analyze crypto charts can help traders recognise formations such as the M pattern and understand price movements.

Here are the main stages of its formation:
The two peaks do not need to be exactly equal. However, they should form near the same resistance zone.
Trading volume can provide additional clues. Volume may decrease during the second upward move and increase during the breakdown. This can suggest weakening buying interest and stronger selling pressure. However, volume patterns are not fixed requirements.

The standard M pattern is bearish because it signals a possible reversal from an upward trend to a downward trend.
Its two peaks show that buyers have failed to push prices above resistance. When price subsequently breaks below the neckline, sellers may gain greater control.
It is important not to confuse the M pattern with the W pattern.
| Parameter | M pattern | W pattern |
|---|---|---|
| Chart formation | Two peaks | Two troughs |
| Common name | Double top | Double bottom |
| Market signal | Bearish reversal | Bullish reversal |
| Confirmation | Break below the neckline | Break above the neckline |
| Potential position | Short | Long |
A double bottom is the opposite formation of a double top. However, both patterns require confirmation before traders consider taking a position.
The M pattern trading strategy involves waiting for a confirmed neckline breakdown before considering a short position.
Traders generally follow these steps:
Step 1: Identify the formation
Find an existing uptrend followed by two peaks near the same resistance level. Mark the lowest point between them.
Step 2: Wait for confirmation
Watch for a decisive price break below the neckline. Many traders wait for a candlestick to close below this level. A strong bearish candle and increased trading volume can provide additional confirmation.
Step 3: Plan the entry
Traders may consider entering a short position after the breakdown. Some wait for price to retest the broken neckline, which may now act as resistance.
Step 4: Set the stop loss
Some traders place a stop-loss above the second peak or a nearby resistance area. The exact level should account for market volatility, the entry price, and the trade setup. A stop-loss order does not guarantee execution at the exact trigger price, especially during periods of high volatility.
Step 5: Calculate the target
Measure the vertical distance between the highest peak and the neckline. Subtract this distance from the neckline to estimate a potential downside target.
Consider a hypothetical asset that forms two peaks at ₹100, with the neckline at ₹90.
| Parameter | Example price |
|---|---|
| First peak | ₹100 |
| Second peak | ₹100 |
| Neckline | ₹90 |
| Pattern height | ₹10 (₹100 − ₹90) |
| Breakdown entry | ₹89 |
| Stop-loss level | Above ₹100 |
| Estimated target | ₹80 (₹90 − ₹10) |
Hypothetical example. The target is a measured-move estimate, not a guaranteed price.
A confirmed M pattern requires a decisive break below the neckline. The two peaks alone are not enough to establish a bearish reversal.
Traders can look for these supporting signals:
These signals can strengthen the trading setup, but they do not eliminate the possibility of a false breakout.
The M pattern can help traders identify possible bearish reversals, but it does not provide a guaranteed trading signal.
Its reliability depends on the broader market trend, timeframe, trading volume and breakout strength. A pattern that forms after a sustained uptrend may carry more significance than two peaks within a narrow sideways range.
Traders can also use other technical indicators, such as the Relative Strength Index (RSI) and moving averages, to assess momentum and market direction.
The best approach is to combine chart formations with price action, support and resistance, and risk management rather than relying on one signal. The pattern can also fail if price moves back above the neckline after the breakdown.
M pattern trading provides a way to identify potential bearish reversals through price action, resistance levels and neckline breakouts. Traders can use the double-top formation to plan short entries, stop losses and potential take-profit targets.
However, the pattern is not always successful. Waiting for confirmation, checking trading volume and maintaining a suitable risk-reward ratio are important parts of the strategy.
At Mudrex, you can explore eligible futures contracts with INR margin and take long or short positions based on your market outlook. If you want to apply your technical analysis skills to crypto markets, explore the available contracts and understand their risks before getting started. Trade Now.
To build stronger conviction in crypto investing, explore in-depth guides on Mudrex Learn and subscribe to the Mudrex YouTube channel for insights on markets, tokens, and long-term crypto trends.
M pattern trading is a technical analysis strategy based on the double-top chart formation. It signals a possible bearish reversal when price breaks below the neckline.
Look for two price peaks near the same resistance level, separated by a decline. A break below the middle trough, known as the neckline, confirms the formation.
The standard M pattern is bearish because it indicates a possible shift from an uptrend to a downtrend. Its opposite, the W pattern, is generally bullish.
Traders generally wait for a confirmed neckline breakdown before considering a short position. They then plan their entry, stop loss and take-profit target based on the pattern structure.
A candlestick close below the neckline confirms the standard M pattern. Higher trading volume and a failed retest of the neckline can provide additional confirmation.
A stop loss is commonly placed above the second peak or a nearby resistance zone. The exact placement should consider volatility, position size and the trader’s risk tolerance.
M pattern trading and cryptocurrency futures involve substantial financial risks, including the possible loss of invested capital. Futures leverage can magnify both gains and losses and may result in rapid liquidation. All examples in this article are illustrative and should not be considered financial or investment advice. Conduct your own research (DYOR) and consult a qualified financial adviser before making trading decisions.