
A market downtrend can make it difficult to tell whether prices will continue falling or begin to recover. A sudden rise may look like a reversal, but not every green candle signals a change in market direction. Acting on such moves without enough context can lead to poorly timed trades.
This is where the bullish engulfing pattern can help. It is a two-candle formation in which a bullish candle’s real body completely covers the real body of the preceding bearish candle. When it appears after a downtrend, it may signal a shift in buying pressure and a possible bullish reversal.

In this blog, we explain how the bullish engulfing pattern works, how to identify it on a crypto chart, and how traders can use it to plan potential entry and exit points.
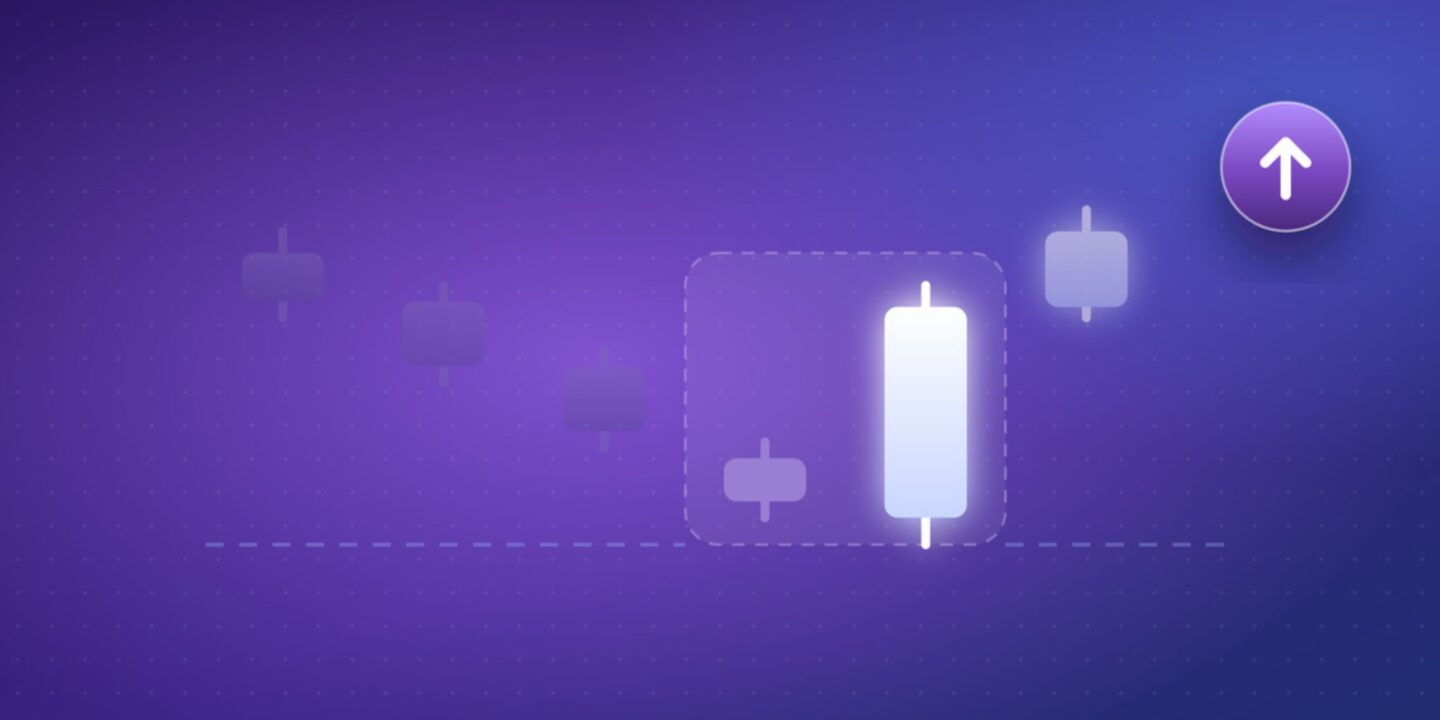
The bullish engulfing candlestick pattern is the formation of two candles. This may signal a change from a downtrend to an uptrend. It appears when a large candle covers the body of the previous red candle. While the first candle shows selling pressure, the second shows that buyers are pushing prices higher. The change suggests that buyers are gaining control of the market.
There are two main parts of a bullish engulfing pattern. They are:
First candle (Bearish): It is a red candle that forms when sellers push the price down.
Second candle (Bullish): It is a larger green candle that forms and covers the entire body of the first candle.

It is easy to find a bullish engulfing pattern by looking at two candles that form after a price decline. Here, the second candle must be larger than the first and cover its entire body.
Some of the important things to check include,
Previous trend: The pattern should come after a downtrend.
The candle shadows, also called wicks, do not need to be covered. Only the real bodies matter when identifying this pattern.
The pattern means a possible change in market sentiment. It indicates a reversal from bearish to bullish, suggesting that buyers are gaining control after a period of selling pressure.
Here is what happens when this pattern forms:
However, this does not mean the price will always increase. Traders should check the next candle, trading volume, and nearby support levels before entering a trade.
A simple example will help you understand how the bullish engulfing pattern forms on a trading chart. Suppose Bitcoin is trading at $90,000 after a price correction.
Suppose two candles form one after another:
| Metric | First candle | Second candle |
| Open | $90,000 | $89,000 |
| High | $90,500 | $92,000 |
| Low | $88,500 | $88,800 |
| Close | $89,000 | $91,500 |
| Candle type | Bearish | Bullish |
In this example, the first candle opens at $90,000 and closes at $89,000. This shows notable selling pressure. The second candle opens at $89,000 and closes at $91,500. Since the second candle closes above the first candle’s opening price, it covers the entire body of the previous candle. This creates a bullish engulfing pattern.
The formation suggests that buyers are gaining strength. Traders can watch the next candle and trading volume for further confirmation before entering a trade.

You can trade the bullish engulfing pattern by waiting for confirmation and planning your entry, stop loss, and target. This helps you avoid entering a trade based only on one candle formation.
Follow these steps:
1. How Do You Confirm the Pattern Before Entry?
First, wait for the second green candle to close. You can then look for other signs that support a possible price reversal.
Some useful confirmation signals include higher trading volume, a strong support level, a Rising Relative Strength Index (RSI), and a confirmation candle. Definition (Confirmation Candle): A green candle closing above the engulfing candle’s high.
2. Where Should You Enter the Trade?
There are two common ways to enter a bullish engulfing trade:
An early entry may offer a better price, but it carries a higher risk of a false signal. A conservative entry provides more confirmation, but the entry price may be higher.
3. Where Should You Place the Stop Loss?
Traders commonly place a stop loss below the lowest point of the two-candle formation. This helps limit losses if the price moves against the trade.
If the price falls below this level, the expected bullish reversal may no longer be valid. However, sudden market movements can cause a stop-loss order to execute at a different price.
4. How Do You Set a Take-Profit Target?
You can set a take-profit target using nearby resistance levels or a planned risk-reward ratio.
For example, suppose you enter a Bitcoin trade at $92,000 and place your stop loss at $89,000. Your risk is $3,000 per BTC. With a 1:2 risk-reward ratio, your target would be $98,000.
| Trading detail | Price |
| Entry price | $92,000 |
| Stop loss | $89,000 |
| Risk | $3,000 |
| Take-profit target | $98,000 |
| Potential reward | $6,000 |
This is only an example. The pattern does not guarantee that the price will reach the target. Always consider market conditions and manage your risk.
The bullish engulfing pattern can signal a possible trend reversal, but it does not guarantee that prices will rise.
The signal may be stronger when:
However, false signals can occur, especially in sideways markets. Always look for confirmation and use proper risk management.
The bullish engulfing pattern signals a possible upward reversal, while the bearish engulfing pattern signals a possible downward reversal.
| Feature | Bullish Engulfing | Bearish Engulfing |
| First candle | Red | Green |
| Second candle | Green | Red |
| Appears after | Downtrend | Uptrend |
| Possible signal | Price may rise | Price may fall |
| Market sentiment | Bullish | Bearish |
Both patterns use two candles to show a possible change in market direction. However, traders should look for additional confirmation before making a trading decision.
Crypto and tokenised stocks give traders more ways to access different markets. They also offer some benefits compared with traditional trading.
However, trading also involves risks. Leverage can increase both profits and losses. Tokenised stocks may offer price exposure without giving you direct ownership of the shares. Always understand the risks before trading.
The bullish engulfing pattern helps traders identify a possible shift from selling pressure to buying pressure. It is easy to spot using two candles, but it does not guarantee a price reversal.
You can use this pattern with trading volume, support levels, and other indicators to make better trading decisions. Always set a stop loss and manage your risk before entering a trade.
Ready to explore crypto futures trading?
Trade Now on Mudrex.
To build stronger conviction in crypto investing, explore in-depth guides on Mudrex Learn and subscribe to the Mudrex YouTube channel for insights on markets, tokens, and long-term crypto trends.
It is a two-candle pattern that may signal a change from a downtrend to an uptrend. The second green candle covers the body of the previous red candle.
Look for two candles after a price decline. The second candle must be green and cover the entire body of the first red candle.
It is a bullish pattern. It suggests that buyers may be gaining control after a period of selling pressure.
Wait for the pattern to form and look for confirmation through volume, support levels, or the next candle. Then plan your entry, stop loss, and target.
Higher trading volume, a nearby support level, and a following green candle closing above the pattern’s high can strengthen the signal.
Traders commonly place a stop loss below the lowest point of the two-candle formation. This helps limit losses if the price moves against the trade.
Crypto trading involves market risks and may lead to financial losses. Leverage can increase both profits and losses. The examples in this article are for learning purposes only and are not financial advice. Always do your own research and consult a qualified financial advisor before trading.