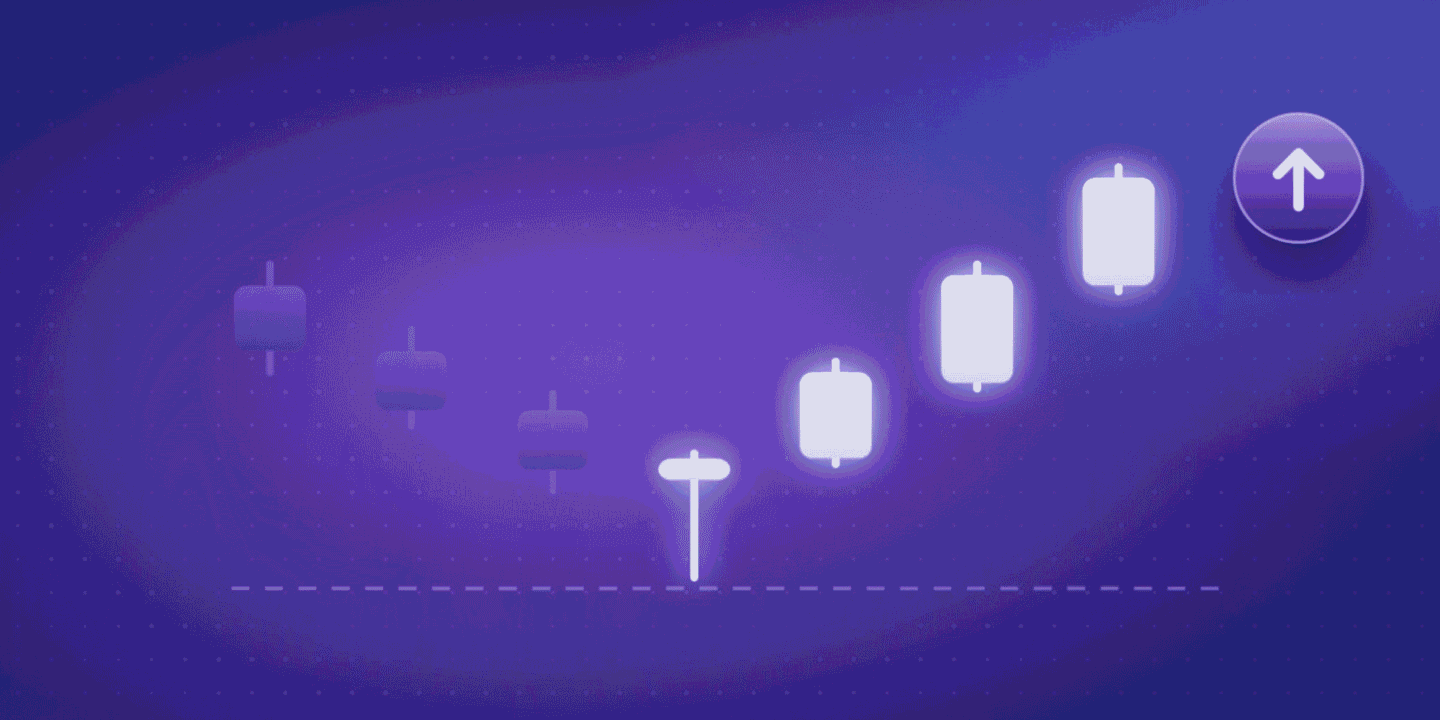

Bullish candlestick patterns help traders identify possible price reversals and rising buying pressure. However, recognising these patterns is not always easy. A bullish signal can fail if traders ignore market trends, trading volume and key price levels.
Understanding these patterns can help you read price action and plan trades more carefully. This guide explains the most common bullish candlestick patterns, their meaning, how to identify them, and how to use them in crypto trading.

Bullish candlestick patterns are formations on price charts that suggest buyers may be gaining control over sellers. They often appear after a price decline and can signal a possible bullish reversal.
A candlestick represents the opening, closing, highest and lowest prices of an asset during a selected period.
A bullish pattern can form through one, two or three candles. Its meaning depends on the market trend and the price level where it appears.
Bullish candlestick patterns help traders identify possible reversals and changes in buying pressure. Here are six commonly used patterns.
The Bullish Engulfing pattern is a two-candle formation that may signal a reversal from a downtrend to an uptrend.
It forms when a small bearish candle is followed by a larger bullish candle whose body completely covers the previous candle’s body. The first candle shows selling pressure, while the second suggests that buyers have gained control.
How to identify it:
Traders often wait for the next candle to close above the engulfing candle’s high before considering an entry.

Hammer Candlestick Pattern
The Hammer is a single-candle bullish reversal pattern that usually appears after a downtrend.
It has a small body near the upper end of its range and a long lower wick. This formation suggests that sellers pushed prices down, but buyers recovered much of the decline.
How to identify it:
A bullish candle following the Hammer can provide additional confirmation of buying pressure.

The Morning Star is a three-candle bullish reversal pattern that forms near the bottom of a downtrend. It shows a shift from strong selling pressure to indecision and then buying interest.
How to identify it:
Traditional Morning Star patterns often include gaps between the candles. However, these gaps are less common in continuously traded crypto markets, where traders may focus more on the candle bodies and overall price movement. Traders often look for the third candle to close above the midpoint of the first candle’s body. This can strengthen the reversal signal.

The Piercing Line is a two-candle bullish reversal pattern that may indicate a change in market sentiment.
It forms when a bullish candle follows a bearish candle and closes above the midpoint of the previous candle’s body.
How to identify it:
This pattern suggests that buyers are pushing back against selling pressure.

The Three White Soldiers pattern consists of three consecutive bullish candles. It may signal a strong shift towards buying pressure after a decline or consolidation.
How to identify it:
However, traders should avoid chasing the price if the pattern appears after an extended rally. The market may already be overbought.

The Bullish Harami is a two-candle formation that may indicate a slowdown in selling pressure. It forms when a small bullish candle appears within the body of a larger bearish candle.
How to identify it:
A bullish breakout above the second candle’s high can provide additional confirmation./

You can identify bullish candlestick patterns by studying candle formations, market trends and important price levels.
Follow these steps:
Remember that a pattern alone does not confirm a market reversal. Combining it with price action and technical indicators can provide better context.
You can trade bullish candlestick patterns by combining pattern recognition with breakout confirmation and risk management.
A basic trading approach involves the following steps:
Entry and exit levels depend on the pattern, market volatility and trading timeframe.
| Parameter | Trading approach |
|---|---|
| Entry price | After bullish confirmation or a breakout |
| Stop-loss level | Below the pattern’s low or nearby support |
| Take-profit target | Near the next resistance level |
| Breakout level | Above the pattern’s high or key resistance |
| Risk-reward ratio | Compare the potential loss with the expected profit |
Traders can use nearby resistance levels, previous swing highs and the risk-reward ratio to estimate take-profit targets. The target should also account for market volatility and the distance between the entry price and stop-loss level.
Bullish candlestick patterns are useful technical analysis tools, but their reliability depends on market conditions and confirmation.
A Bullish Engulfing pattern near support with rising volume may provide a stronger signal than the same pattern in the middle of a sideways market.
Traders should consider:
No candlestick formation guarantees a successful trade. Traders should combine chart patterns with disciplined risk management.
Traditional markets and crypto or tokenised assets offer different ways to access market opportunities. Each has its own benefits, trading hours and risks.
| Feature | Traditional markets | Crypto or tokenised assets |
|---|---|---|
| Market access | Depends on the exchange and investment route | Access to crypto and selected global assets |
| Trading hours | Generally follow exchange schedules | Crypto operates 24/7; tokenised asset hours vary |
| Long and short positions | Depend on the product and market rules | Futures can support both positions |
| Starting capital | Depends on asset prices and broker requirements | Smaller positions may be available |
| Margin currency | Depends on the broker and product | INR margin is available for eligible Mudrex futures contracts |
| Global exposure | May require international investment routes | Selected global assets can be accessed through available products |
At Mudrex, you can explore crypto futures trading with INR margin and access selected global tokenised stock-linked assets. Futures allow traders to take long or short positions based on their market view.
However, crypto futures involve leverage and can lead to liquidation. Tokenised stock-linked products may not provide direct ownership of the underlying shares. Understand the product structure and risks before trading.
Bullish candlestick patterns help traders understand buying pressure and identify possible market reversals. Patterns such as Bullish Engulfing, Hammer and Morning Star can provide useful trading signals when supported by volume, trend analysis and key price levels.
However, no pattern works every time. Traders should confirm signals, plan entry and exit levels, and use stop losses to manage risk.
At Mudrex, you can explore crypto futures with INR margin and access available trading opportunities across supported assets. Understand the risks and build a trading strategy that suits your goals. Trade Now
To build stronger conviction in crypto investing, explore in-depth guides on Mudrex Learn and subscribe to the Mudrex YouTube channel for insights on markets, tokens, and long-term crypto trends.
Bullish candlestick patterns are chart formations that suggest buying pressure may be increasing. They can indicate a possible upward price movement or reversal.
Look for formations such as Bullish Engulfing, Hammer and Morning Star on a candlestick chart. Check the market trend, support levels and trading volume for confirmation.
Bullish candlestick patterns indicate potential upward price movement. However, they do not guarantee that the market will rise.
Identify a pattern, wait for confirmation and plan your entry, stop loss and take-profit target. Consider market trends and trading volume before entering.
A follow-up bullish candle, higher trading volume and a breakout above resistance can strengthen a bullish signal. Confirmation depends on the pattern, market trend and surrounding price action.
A stop loss is generally placed below the pattern’s low or a nearby support level. The exact position depends on market volatility and the trade setup.
Cryptocurrency trading and futures involve significant market risks, including the possible loss of invested capital. Leverage can magnify both gains and losses and may lead to liquidation. Candlestick patterns and trading examples in this article are for educational purposes only and do not constitute financial or investment advice. Conduct your own research (DYOR) and consult a qualified financial adviser before making trading decisions.