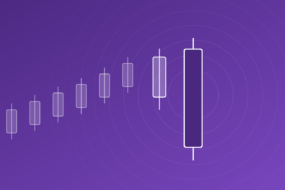

Markets rarely move in a straight line for long. After a sharp rally, price usually pauses while early buyers take profits and new buyers wait for a better entry. Sometimes that pause looks messy. Sometimes it looks like a neat little flag hanging off a pole.
That second shape is the flag and pole pattern, one of the most recognisable continuation setups in technical analysis. This guide covers what it means, how to identify it, whether it is bullish or bearish, how to trade it with a clear entry, stop loss and target, and what a real Bitcoin flag from 2026 teaches about its limits.

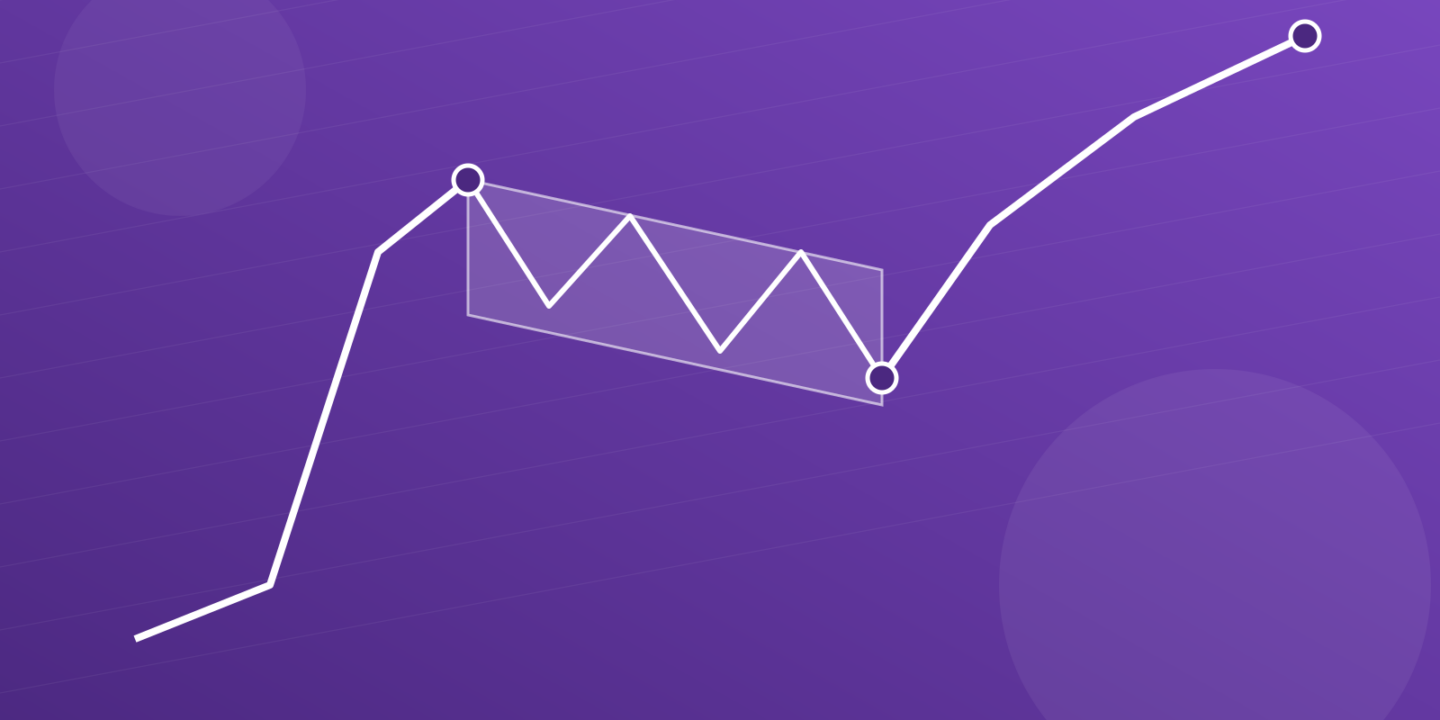
The flag and pole pattern is a chart formation with two parts:
The pole shows strong momentum. The flag shows the market catching its breath without giving much back. When price breaks out of the flag in the direction of the pole, it signals trend continuation.

Check for five things on the candlestick chart:
Flags are close cousins of pennants. The difference is shape: a flag is a parallel channel, while a pennant is a small converging triangle.
It can be either. The direction comes from the pole.

Because flags are continuation patterns, they work best when they agree with the broader market trend. A bull flag inside a long downtrend is fighting the tide. For a side-by-side breakdown of both versions, read Bull and Bear Flag Patterns.
A flag and pole pattern trading strategy comes down to three levels.
That measured move is ambitious, so many traders take partial profits at half the pole height and trail the rest.
The pattern works in both directions, which is where crypto futures help: you can go long on a bull flag or short on a bear flag. Leverage magnifies both outcomes, so size every trade from the stop loss and understand how liquidation works first.
READ MORE: Understanding the Bear Flag Pattern in Crypto
Here is a hypothetical BTC futures long. The numbers are illustrative, not a forecast.
Bitcoin rallies from $70,000 to $80,000 in four strong candles on rising volume. That is the pole, with a height of $10,000. Price then drifts lower in a tight channel, with a flag low of $76,000 and fading volume. Finally, a candle closes at $79,200, well above the flag’s upper trendline (near $77,400 at that point), with volume returning.

| Metric | Calculation | Value |
| Pattern height (pole) | $80,000 minus $70,000 | $10,000 |
| Entry price | Breakout candle close | $79,200 |
| Stop-loss level | Just below the $76,000 flag low | $75,800 |
| Risk per BTC | $79,200 minus $75,800 | $3,400 (4.29%) |
| Partial target | 79,200plushalfthepole(5,000) | $84,200 |
| Full target | $79,200 plus $10,000 | $89,200 |
| Reward to full target | $89,200 minus $79,200 | $10,000 (12.63%) |
| Risk-reward ratio | $10,000 divided by $3,400 | About 1:2.9 |
With 5x leverage, a stop-loss hit costs about 21.5% of your margin (4.29% x 5), and the full target returns about 63.1% (12.63% x 5), before fees and funding. To see these levels in rupees, plug them into the BTC to INR converter.
This one is recent, and it is a useful reminder of how flags behave in practice.

What happened next: Bitcoin topped out around $87,000 to $87,500 in September, covering less than half the projected move. By October it was trading near $82,319, and on November 8 it fell to $73,510, its lowest level since August 21 and well below the breakout zone.
The pattern did its first job: the breakout was real and price pushed higher. It did not deliver the textbook target. Traders who booked partial profits near the September high and trailed their stop kept gains. Traders who waited for $98,000 likely gave it all back.
Less reliable than its reputation. In Bulkowski’s bull-market stock data, flags had a break-even failure rate of 44% for upward breakouts and 45% for downward breakouts. The average move was 9% up or 8% down, and only 46% of flags reached their price target.
That matches the Bitcoin example above. Use these filters to improve the odds:
Flags are one tool among many. Technical analysis works best with context, including where the broader trend may be turning, which is covered in How to Spot Trend Reversal in Crypto.
READ MORE: Top Crypto Chart Patterns for Cryptocurrency Trading
The pattern itself works on any liquid chart, from Bitcoin to US stocks. What matters is being able to trade the breakout in either direction, whenever it comes.
| Factor | Crypto and tokenised stocks | Traditional markets |
| Market access | Global assets like Bitcoin and US stock exposure from India | Mostly domestic exchanges, or overseas routes with extra paperwork |
| Market hours | Crypto trades 24×7; tokenised stock hours vary by product | Fixed exchange sessions |
| Long or short | Futures let you trade bull flags long and bear flags short | Retail shorting usually needs F&O or is limited to intraday |
| Starting capital | Bitcoin futures on Mudrex start from ₹100 | Often higher, as many stocks trade in whole shares |
| Funding | INR margin, no INR to USDT conversion needed | Overseas investing typically runs through LRS remittances |
The risks are just as real. Crypto is highly volatile, leverage (up to 100x on some platforms) can wipe out margin in a single move, and tokenised products carry their own structural risks. Use a stop loss on every trade and only risk what you can afford to lose.
The flag and pole pattern captures a market that is pausing, not reversing. It is easy to spot and gives clean levels for entry, stop loss and target. But nearly half of flags fail to follow through, so trade only tight flags with strong poles, wait for a confirmed breakout on volume, and bank partial profits well before the full measured move.
What is the flag and pole pattern? It is a continuation pattern made of a sharp price move (the pole) followed by a short, tight consolidation channel (the flag). A breakout in the pole’s direction signals the trend may resume.
How do you identify the flag and pole pattern? Look for a steep pole on strong volume, then a brief, narrow channel sloping against it, with fading volume. The flag should retrace only a small part of the pole.
Is the flag and pole pattern bullish or bearish? It can be both. A bull flag follows a rising pole and breaks upward. A bear flag follows a falling pole and breaks downward.
How do you trade the flag and pole pattern? Enter on a candle that closes outside the flag in the pole’s direction, place the stop beyond the opposite side of the flag, and target the pole height added to the breakout level.
What confirms the flag and pole pattern? A candle close beyond the flag’s trendline in the direction of the pole, ideally with a clear rise in trading volume. A wick through the line alone is not confirmation.
Where should stop loss be placed for the flag and pole pattern? For a bull flag, just below the flag’s lowest low. For a bear flag, just above the flag’s highest high. If price re-enters and crosses the flag, the setup has failed.