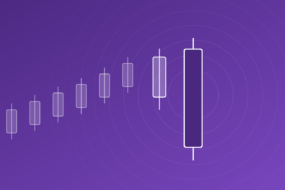

Most triangle patterns tighten. Price swings get smaller, volatility dries up, and traders wait for the squeeze. The expanding triangle chart pattern does the opposite. Every swing is bigger than the last, and the chart looks like the market is arguing with itself.
That is exactly why it is worth learning. An expanding triangle tells you the market has no agreed direction yet, and that the eventual breakout can be sharp. This guide covers the meaning of the pattern, how to identify it, whether it is bullish or bearish, and how to trade it with a clear entry, stop loss and target. You will also find a worked example and a real Bitcoin chart.

The expanding triangle chart pattern is a price formation where the market prints higher highs and lower lows at the same time. Draw one trendline across the highs and another across the lows, and the two lines move away from each other instead of converging. You will also see it called a broadening formation or a megaphone pattern.
In plain terms, buyers push each rally further than the last, and sellers push each drop deeper. Neither side wins, so the range keeps widening. That makes it a volatility pattern first and a direction pattern second.

Look for four things on the candlestick chart:
Higher timeframes such as the daily or weekly chart give more reliable formations. On a 5-minute chart, wide swings are often just noise.
READ MORE: Top Crypto Chart Patterns for Cryptocurrency Trading
Neither, until price breaks out. Thomas Bulkowski’s research on broadening tops found they break out upward about 60% of the time. That is close enough to a coin flip that the shape alone should not set your bias.
After a long uptrend, the pattern often signals distribution and a possible bearish reversal, similar in spirit to a double top. After a long downtrend, it can mark a bullish reversal. In the middle of a trend, it can act as trend continuation.
What actually decides the trade is breakout confirmation: a candle that closes beyond a trendline on rising trading volume.

Traders usually approach this expanding triangle chart trading pattern in one of two ways.
Breakout trading (more conservative). Wait for a confirmation candle to close outside the pattern.
Range trading (more aggressive). Buy near support and sell near resistance while the pattern holds. Because every swing is bigger than the last, stops have to be wider, and a single breakout against you can erase several winning trades.
Either way, crypto futures let you trade both directions, which suits a pattern that can break either way. Leverage magnifies gains and losses equally, so size the position from your stop loss, not from how confident you feel.
Here is a hypothetical BTC futures long. The numbers are illustrative, not a forecast.
The swings are HH1 at $62,000, LL1 at $58,000, HH2 at $63,500 and LL2 at $56,500. Price then rallies and closes at $65,500, above the resistance line (which sits near $65,000 at that point), with a clear volume spike.

| Metric | Calculation | Value |
| Entry price | Breakout candle close | $65,500 |
| Pattern height | $63,500 minus $56,500 | $7,000 |
| Take-profit target | $65,500 plus $7,000 | $72,500 |
| Stop-loss level | Just below HH2, back inside the pattern | $63,300 |
| Risk per BTC | $65,500 minus $63,300 | $2,200 (3.36%) |
| Reward per BTC | $72,500 minus $65,500 | $7,000 (10.69%) |
| Risk-reward ratio | $7,000 divided by $2,200 | About 1:3.2 |
Now add leverage. At 5x, a stop-loss hit costs about 16.8% of your margin (3.36% x 5), while reaching the target returns about 53.4% (10.69% x 5), before fees and funding. If price slips back inside the pattern and stalls, treat the breakout as failed and exit rather than hoping.
Want to see what these levels mean in rupees? Run them through the BTC to INR converter.
Bitcoin offers one of the clearest large-scale examples.
Analyst Gert van Lagen flagged that Bitcoin broke above the upper trendline of this four-year megaphone in November 2024, and projected a target of $270,000 to $300,000.

Now run the textbook measured move. Pattern height is $69,000 minus $15,476, or $53,524. A trendline joined through the two highs sits near $90,700 in mid-November 2024, which gives a target of roughly $144,200. Bitcoin peaked at $126,198 in October 2025, about two-thirds of that projected move, and then pulled back.
The takeaway: the breakout direction was right, but the target was not. Treat take-profit targets as zones to scale out, not promises.
This is not a one-off either. Bitcoin also formed a bearish megaphone on its daily chart as it approached its then-record near $20,000 in late 2017.
It is less dependable than tighter patterns, for three reasons:
Use it alongside volume confirmation, a defined invalidation level and the broader trend. Technical analysis works best with context, not as a standalone signal.
READ MORE: Bull and Bear Flag Patterns | What Is an Inverted Cup and Handle Pattern?
The pattern itself works on any liquid chart, from Bitcoin to US stocks. What matters is being able to trade the breakout in either direction, whenever it comes.
| Factor | Crypto and tokenised stocks | Traditional markets |
| Market access | Global assets such as Bitcoin and US stock exposure from India | Mostly domestic exchanges, or overseas routes with extra paperwork |
| Market hours | Crypto trades 24×7; tokenised stock hours vary by product | Fixed exchange sessions |
| Long or short | Futures let you go long or short | Retail shorting usually needs F&O or is limited to intraday |
| Starting capital | Spot crypto from ₹100 on Mudrex | Often higher, as many stocks trade in whole shares |
| Funding | INR margin, no separate currency conversion step | Overseas investing typically runs through LRS remittances |
The flip side matters just as much. Crypto is highly volatile, leverage can wipe out margin quickly, and tokenised products carry their own structural risks. Trade only what you can afford to lose, and always set a stop loss.
The expanding triangle chart pattern is the market telling you it is undecided and getting louder about it. It will not tell you direction on its own, but it does tell you a large move is building. Wait for a confirmed breakout on volume, define your stop before you enter, use the pattern height as a guide rather than a guarantee, and keep leverage modest.
What is the expanding triangle chart pattern? It is a formation of higher highs and lower lows that creates two diverging trendlines. It is also called a broadening formation or megaphone pattern, and it signals rising volatility and indecision.
How do you identify the expanding triangle chart pattern? Look for at least two higher highs and two lower lows, a rising resistance line, a falling support line, and price swinging cleanly between them, ideally on daily or weekly charts.
Is the expanding triangle chart pattern bullish or bearish? It is neutral until a breakout. Bulkowski’s research found broadening tops break upward about 60% of the time, so trend context and confirmation matter more than the shape.
How do you trade the expanding triangle chart pattern? Most traders wait for a candle to close outside the pattern on rising volume, enter on that close or a retest, set a stop inside the pattern, and target the pattern height from the breakout.
What confirms the expanding triangle chart pattern? A candle that closes beyond the resistance or support trendline, backed by a clear rise in trading volume. A wick through the line without a close is not confirmation.
Where should stop loss be placed for the expanding triangle chart pattern? Place it back inside the pattern, just beyond the last swing high for a long or the last swing low for a short. If price returns there, the breakout has likely failed.