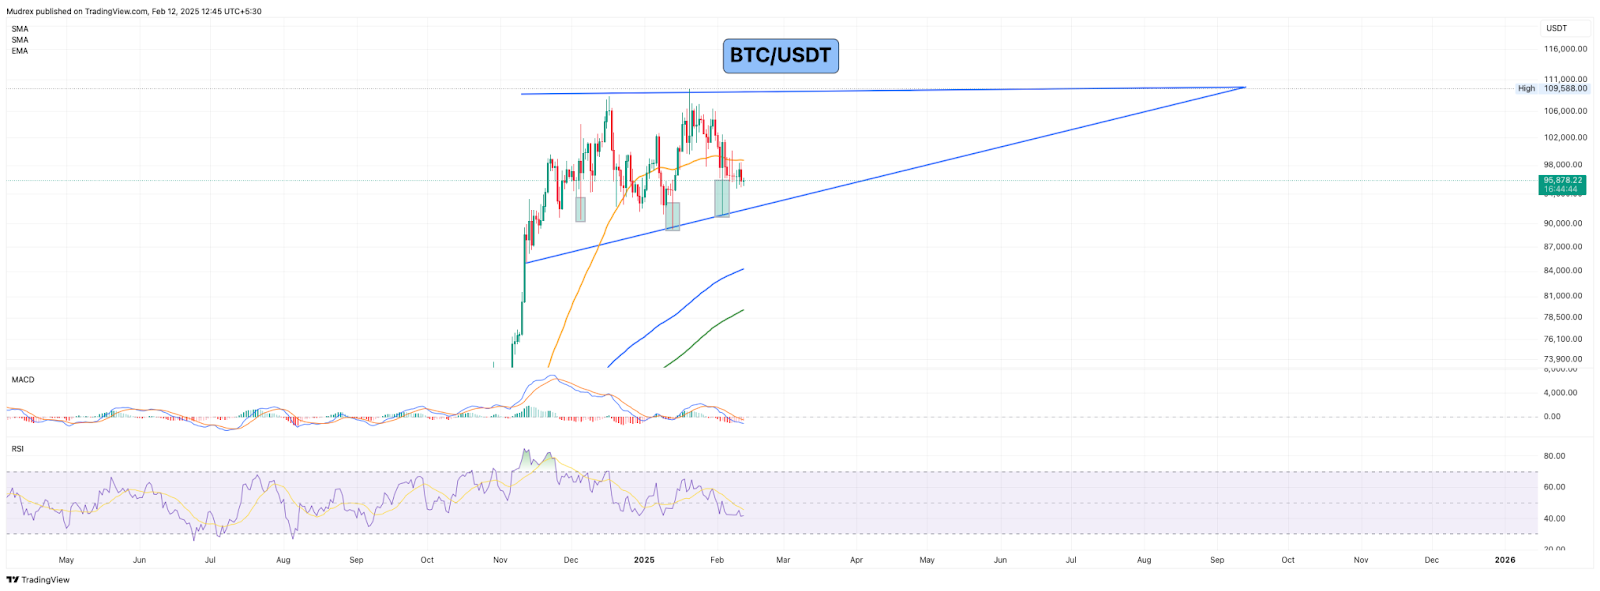
On February 11, 2025, Bitcoin (BTC) experienced a 2.5% decline in the previous 24 hours, trading at approximately $94,552. The global crypto market cap dipped by 1.5% to $3.12 trillion.
Bitcoin’s market dominance remained strong at 60.9%, with a market cap of $1.89 trillion and trading volume increasing to $49.5 billion, indicating active market participation.
The decline is attributed to technical factors, regulatory uncertainties, and global economic conditions, which we’ll explore below.
Key Reasons Why Bitcoin Price Is Dropping
1. Technical Breakdown & Market Sentiment
- Bitcoin dipped below $95,000, with posts on X and market analyses noting bearish trading patterns in shorter time frames. The 2.5% decline aligns with increased volatility, though some investors remain optimistic about long-term trends.
- Trading volume increased to $49.5 billion, but retail interest appeared cautious, with the Market Fear & Greed Index at 32 (Fear) out of 100,, reflecting a cautious market sentiment.
2. Regulatory Issues & Government Crackdowns
- President Trump’s tariff announcements (25% on steel and aluminum, as noted in posts on X) continued to add uncertainty. While no new regulations were explicitly announced on February 11th, anticipation of stricter policies in response to global economic shifts weighed on sentiment.
- Japan’s Financial Services Agency considering lifting the ban on Bitcoin and crypto ETFs (as per posts on X) created a mix of optimism and caution, though specific impacts on February 11th were not detailed.
3. Large Market Sell-Offs & Liquidations
- Posts on X suggested significant buying pressure at $100,000 daily, with institutional bidding noted. However, the 2.5% price dip could indicate sell-offs by some large holders (whales), though specific data on whale activity for February 11th was not detailed in credible sources.
- The increase in trading volume ($49.5 billion) could indicate liquidations or forced selling, especially as the market braced for volatility ahead of economic data releases.
4. Global Economic Uncertainty
- Global economic concerns, including ongoing tariff impacts and anticipated U.S. economic data, created uncertainty. Investors appeared to shift focus to traditional assets amid fears of inflation or economic slowdown, contributing to the 1.5% dip in the global crypto market cap.
- Increased volatility in broader financial markets, with posts on X noting tariff impacts, led some investors to move away from riskier assets like Bitcoin, contributing to the 2.5% price decline.
Technicals
This section provides a detailed technical analysis of Bitcoin’s price movements on February 11, 2025, based on the provided pointers:
- Price Movement: BTC moved downwards by 2.5%, trading at approximately $94,552,
- Chart Patterns: In the 1-day (1D) timeframe, BTC is forming a bullish ascending triangle, indicating potential upward momentum if the pattern completes. However, the current 2.5% decline suggests short-term bearish pressure.
- Volatility and Price Compression: Prices and volatility are compressing, which typically indicates a significant movement upcoming. This aligns with the increased trading volume ($49.5 billion) observed on February 11th.
- Trend Line Support: BTC is following trend line support in the range of $94,000 to $95,000. The current price of $94,552 is testing this support zone, and a break below could signal further declines.
- Moving Averages (4H Timeframe): In the 4-hour (4H) timeframe, moving averages indicate a strong sell signal for BTC, reflecting bearish momentum in the short term.
- Oscillators (4H Timeframe): Oscillators remain neutral, suggesting no clear directional bias in the short term.
- MACD (4H Timeframe): The Moving Average Convergence Divergence (MACD) is still bearish, indicating continued downward pressure in the 4H timeframe.
- RSI (4H Timeframe): The Relative Strength Index (RSI) is neutral but entering the oversold zone, suggesting potential for a reversal if buying pressure increases.
 How Is the Market Reacting?
- The broader crypto market mirrored Bitcoin’s decline, with total market capitalization dipping by 1.5% to $3.12 trillion. Ethereum (ETH) saw a 1.8% decline, trading at $2,586, while other altcoins like Solana (SOL) and Ripple (XRP) saw minor dips
- Despite the price drop, trading volumes remained high, with Bitcoin’s volume at $49.5 billion, indicating active participation. Posts on X suggested cautious optimism, with some investors anticipating recovery if economic data aligns with expectations and regulatory clarity improves.
Frequently Asked Questions (FAQs)
Why is Bitcoin falling today?
Bitcoin’s 2.5% decline on February 11, 2025, was driven by technical breakdowns, regulatory uncertainties, potential sell-offs, and global economic concerns, including tariff impacts and anticipation of U.S. economic data.
Will Bitcoin recover from this drop?
Recovery depends on upcoming economic data, regulatory developments, and market sentiment. Bitcoin’s strong market dominance (60.9%) and high trading volume ($49.5 billion) suggest continued interest, with technical indicators like the bullish ascending triangle in the 1D timeframe offering potential for recovery.
Is this a good time to buy Bitcoin?
The decision to buy depends on your risk tolerance and strategy. The current 2.5% dip may present opportunities, especially if support at $94,000–$95,000 holds, but monitor market trends, economic indicators, and technical signals closely.
Conclusion – What’s Next for Bitcoin?
Bitcoin’s 2.5% price dip on February 11, 2025, reflects technical, regulatory, and economic factors. High trading volumes ($49.5 billion) and market dominance (60.9%) suggest sustained interest. Upcoming U.S. economic data, tariff impacts, and regulatory clarity (e.g., Japan’s potential ETF approval) will shape Bitcoin’s short-term trajectory. Technical analysis indicates potential for significant movement, with support at $94,000–$95,000 and a bullish ascending triangle in the 1D timeframe. Stay informed for daily market updates and consider risks and opportunities in this dynamic market.
This daily market nugget for February 11, 2025, follows the requested format, includes accurate numbers from credible sources (CoinMarketCap, news.abplive.com, and posts on X referencing these sources), and incorporates your technical analysis pointers in a dedicated “Technicals” section. Let me know if you’d like further adjustments!


