Technical Indicators for Crypto Futures Trading: A Beginner’s Guide
It was 2 a.m. and Rohan couldn’t sleep.
He’d opened his first BTCUSDT perpetual futures position that evening, sure the price was about to fly. Green candles everywhere. It felt right. By midnight the trade was underwater, and he was refreshing the chart every ninety seconds, hoping. The problem wasn’t his luck. The problem was that he’d bought at the exact moment every signal on the screen was screaming “wait.”
If you’ve ever felt that knot in your stomach, this guide is for you. The good news: the technical indicators for crypto futures trading that would have warned Rohan are the same handful you can learn this week. They don’t predict the future. They read the crowd, the momentum, and the pressure building underneath the price, so you stop trading on gut feeling and start trading on evidence.
By the end, you’ll know which indicators to watch, what each one is actually telling you, and how to stack a few together into a setup you can trust.
best trading Indicators- youtube video
What Technical Analysis Really Means
Picture the price chart as a conversation between buyers and sellers. Every candle is a sentence. On its own, a single sentence tells you little. Read a paragraph of them together and a story appears: who’s winning, who’s tiring, where the fight keeps happening.
That’s all technical analysis is. Crypto futures technical analysis is the practice of reading past price and volume to judge what’s likely next, not with certainty, but with probability on your side.
Indicators are simply tools that do the reading for you. They take raw price data and turn it into a clean signal, an RSI number, a crossing line, a widening band, so you can decide faster and with less emotion. And in leveraged futures, where a small move can be magnified against you, that discipline is the whole game.
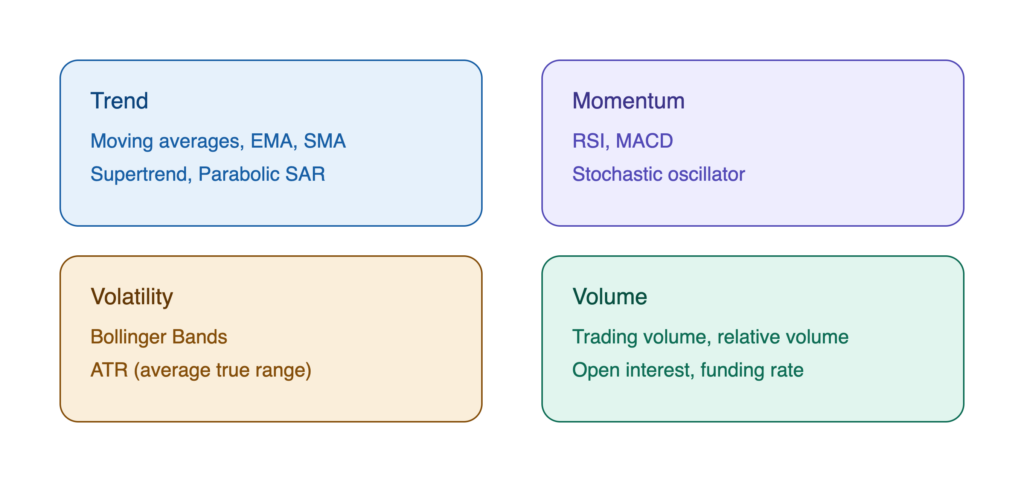
Here’s the mental map to carry with you: most crypto trading indicators fall into four families.
Technical Indicators for Crypto Futures Trading (Beginner's Guide 2026)
Start here, because the trend is the current you’re swimming in.
A moving average smooths out the jagged noise of price into a single flowing line. When price rides above a rising moving average, buyers are in control. When it slips below a falling one, sellers have taken over. Simple, and quietly powerful.
Two flavours matter for beginners:
SMA (simple moving average): the plain average of the last n closes. Calm and slow.
EMA (exponential moving average): weights recent prices more heavily, so it reacts faster to fresh moves.
The two lines traders watch most are the 50-day and the 200-day. When a shorter average crosses above a longer one, momentum is often shifting up; when it crosses below, down. It won’t be perfect, and it will lag, that’s the trade-off for cutting out noise, but it keeps you on the right side of the bigger move.
Rohan’s mistake? He bought while price was stretched far above its moving average, the equivalent of sprinting after a train that had already left the platform.
If moving averages show direction, the Relative Strength Index shows stamina.
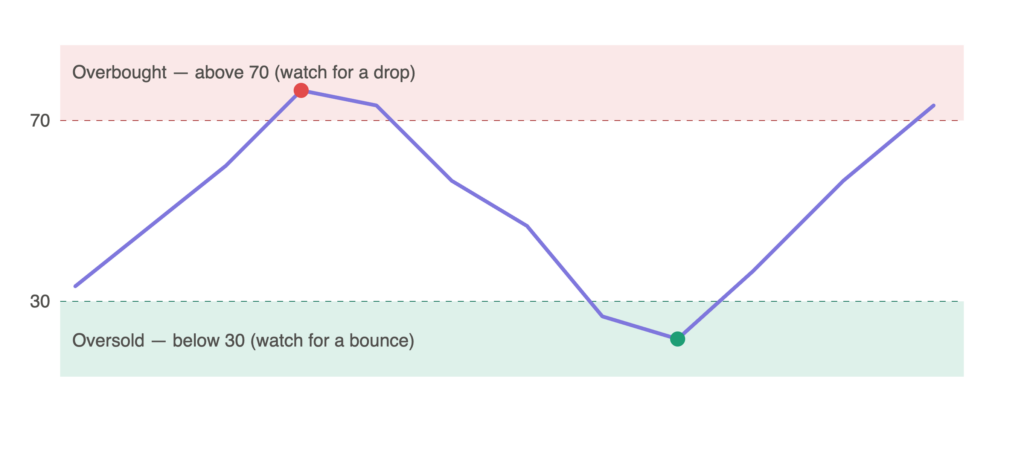
RSI is a momentum gauge that runs from 0 to 100. The rule of thumb: above 70, an asset may be overbought and due for a pause or pullback; below 30, it may be oversold and primed for a bounce.
Technical Indicators for Crypto Futures Trading (Beginner's Guide 2026)
But here’s the nuance beginners miss: in a strong trend, RSI can stay overbought for a long time. So don’t treat 70 as an automatic “sell.” Treat it as a raised eyebrow, a reason to check whether the move still has fuel. RSI in crypto futures trading works best not as a trigger on its own, but as confirmation alongside the trend.
The most valuable RSI signal is divergence: price makes a new high, but RSI makes a lower high. The move looks strong on the surface while its engine is quietly cooling. That’s often the early whisper of a reversal.
MACD (Moving Average Convergence Divergence) takes two moving averages and measures the gap between them, then plots a signal line and a histogram on top.
You don’t need the math. You need the story it tells:
When the MACD line crosses above its signal line, upward momentum is building.
When it crosses below, momentum is fading.
The histogram shows the strength of that push, tall bars mean conviction, shrinking bars mean the move is losing steam.
MACD is a lagging indicator, so it confirms rather than predicts. Used with RSI, it’s a strong pair: RSI flags that a move is stretched, MACD confirms when momentum actually turns.
Volatility is the character of crypto, and Bollinger Bands measure it.
The tool plots a moving average in the middle with two bands above and below that expand and contract with volatility. When the bands squeeze tight, the market is coiling, a big move is often brewing. When they balloon wide, volatility is high and a calmer patch may follow.
Price touching the upper band isn’t a sell signal by itself, and touching the lower band isn’t a buy. Bands describe conditions, not commands. For a futures beginner, the most useful read is the squeeze: quiet before the storm, a heads-up to tighten your risk plan before the fireworks.
Here’s a truth that saves accounts: price without volume is a rumour.
A breakout on heavy volume has conviction behind it. The same breakout on thin volume is often a trap, a move that fizzles the moment the few buyers involved step back. Volume is the crowd’s vote of confidence.
In futures specifically, you also get two extra gauges that spot markets don’t have:
Open interest: the total number of open contracts. Rising open interest into a rising price suggests fresh money backing the move.
Funding rate: in perpetual futures, this shows whether longs or shorts are paying to hold positions, a clue to which side is crowded and possibly overextended.
Zoom out from the indicators for a moment and look at the raw chart. Certain price levels act like floors and ceilings.
Support is a floor where buyers keep stepping in. Resistance is a ceiling where sellers keep appearing. Price bounces between them until one breaks, and a clean break often leads to a fast move as the crowd rushes through the door.
Beginners should recognise a few simple chart patterns that show up again and again:
Breakout: price pushes decisively through support or resistance.
Reversal: the trend runs out of steam and flips (double tops and bottoms are classic).
Continuation: a brief pause inside a trend before it resumes.
These aren’t crystal balls. They’re the terrain. Indicators tell you the weather; support and resistance tell you the landscape.
Putting It Together: The Confluence Trade
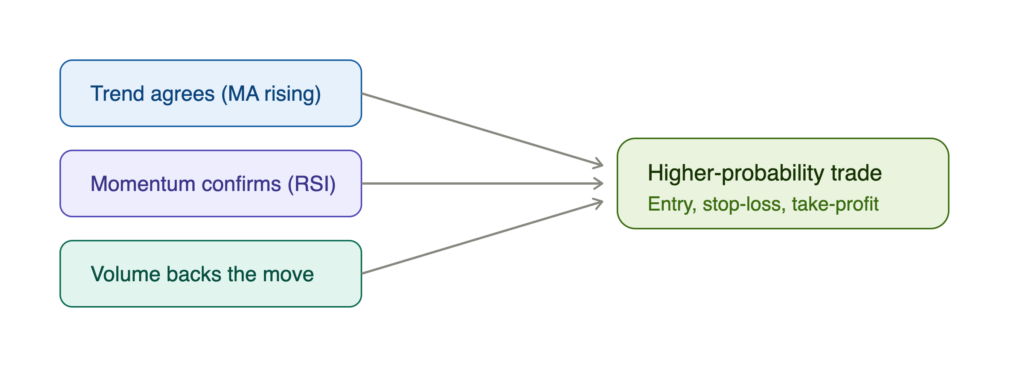
This is where beginners level up. No single indicator wins on its own. The pros wait for confluence, several independent signals pointing the same way.
Technical Indicators for Crypto Futures Trading (Beginner's Guide 2026)
A clean beginner setup looks like this:
Trend: price is above a rising moving average (direction is up).
Momentum: RSI is healthy and not yet overbought; MACD has crossed up (the push is real).
Volume: the move is backed by rising volume (the crowd agrees).
When all three line up, you have a higher-probability trade, and only then do you define your entry, your stop-loss, and your take-profit before you click. That last part matters more than any indicator. In leveraged futures, your risk plan is your seatbelt.
Compare that to Rohan at 2 a.m.: one green feeling, zero confirmation, no exit plan. The tools were right there on his screen. He just hadn’t learned to read them yet.
Quick Reference: Beginner Indicator Cheat Sheet
Indicator
What it tells you
Beginner takeaway
Moving Average (SMA/EMA)
Trend direction
Trade with the trend, not against it
RSI
Momentum, overbought/oversold
Above 70 = stretched; below 30 = oversold
MACD
Momentum shifts
Crossover confirms a turn
Bollinger Bands
Volatility
Squeeze = big move brewing
Volume / Open Interest
Conviction
No volume, no trust
Support & Resistance
Key price levels
Watch for breaks and bounces
Indicator Cheatsheet
The Bottom Line
You don’t need twenty indicators. You need a few you understand deeply, one for trend, one for momentum, one for volume, read together with a clear risk plan. That’s the real edge behind the technical indicators for crypto futures trading, and it’s the difference between Rohan’s sleepless night and a trader who knows exactly why they’re in a position.
Start small. Practise reading the chart before you risk a rupee. Let the signals agree before you act. The market will always be there tomorrow, your capital should be too.
Ready to put this into practice? Open a chart, pick one indicator from the cheat sheet above, and study it across a few days before you trade. When you’re set, you can trade BTCUSDT perpetual futures on Mudrex and apply what you’ve learned, one disciplined setup at a time.
Disclaimer: This article is for educational purposes only and is not financial advice. Crypto futures are highly volatile and leverage can amplify losses. Always do your own research and never risk more than you can afford to lose.
FAQs
What are the best technical indicators for crypto futures beginners?
Start with three: a moving average for trend, RSI for momentum, and volume for conviction. These cover direction, strength, and reliability without overwhelming you. Add MACD and Bollinger Bands once the basics feel natural.
Which indicator is best for crypto futures trading?
There’s no single “best” indicator. Moving averages are the most beginner-friendly starting point because they clarify trend direction, but real edge comes from combining a trend, a momentum, and a volume indicator rather than relying on one.
How is RSI used in crypto futures trading?
RSI measures momentum on a 0–100 scale. Readings above 70 suggest an asset may be overbought, and below 30 suggest oversold. In strong trends it can stay extreme for a while, so it works best as confirmation alongside trend and volume, not as a standalone trigger.
What is MACD in crypto futures trading?
MACD tracks the relationship between two moving averages to reveal momentum shifts. A crossover above the signal line points to building upward momentum, while a crossover below points to fading momentum. It confirms turns rather than predicting them.
Can technical indicators predict crypto futures price movements?
No. Indicators don’t predict, they show probabilities based on past price and volume. They help you make evidence-based decisions and manage risk, but crypto remains volatile and no signal is guaranteed.
Should beginners use multiple indicators together?
Yes, but only a few. Using two or three that measure different things (trend, momentum, volume) gives you “confluence,” where signals confirm each other. Stacking many similar indicators just creates noise and false confidence.
Anupam has over 3 years of experience in the crypto industry, having worked with top indian crypto exchanges. He writes about Bitcoin, altcoins, AI, and emerging tech, helping readers understand what’s driving markets and where the digital asset ecosystem is headed.