
Imagine Bitcoin has been climbing steadily for days. Buyers are in control, trading volume is strong, and every small dip is quickly bought. Then the rally slows. Instead of making another sharp move higher, the price starts drifting sideways before slipping slightly lower. At first glance, it might seem as though the uptrend is losing momentum. But is it?
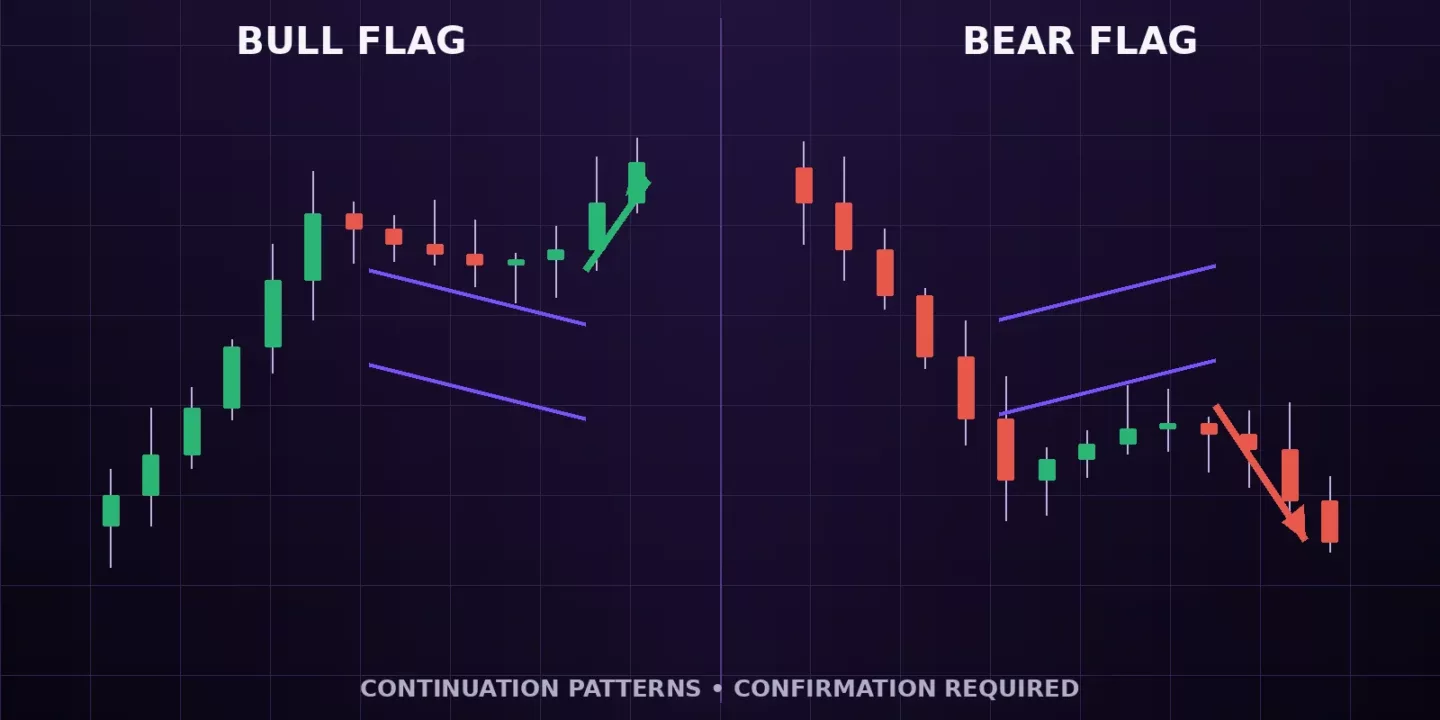
Not every pause signals the beginning of a reversal. Sometimes, it is simply the market taking a breather before continuing in the same direction. This is often where a bull flag pattern begins to appear. The opposite can happen during a downtrend. After a sharp sell-off, prices may recover briefly before sellers regain control and push the market lower again. This formation is known as a bear flag pattern.

Together, bull and bear flag patterns are among the most widely used continuation in technical analysis. Rather than predicting future prices, they help traders understand how markets behave after a strong move and identify situations where the prevailing trend may still have momentum.
This guide explains bull and bear flag patterns, how they form, how traders confirm a breakout or breakdown, and how to plan invalidation levels without treating the setup as a prediction.
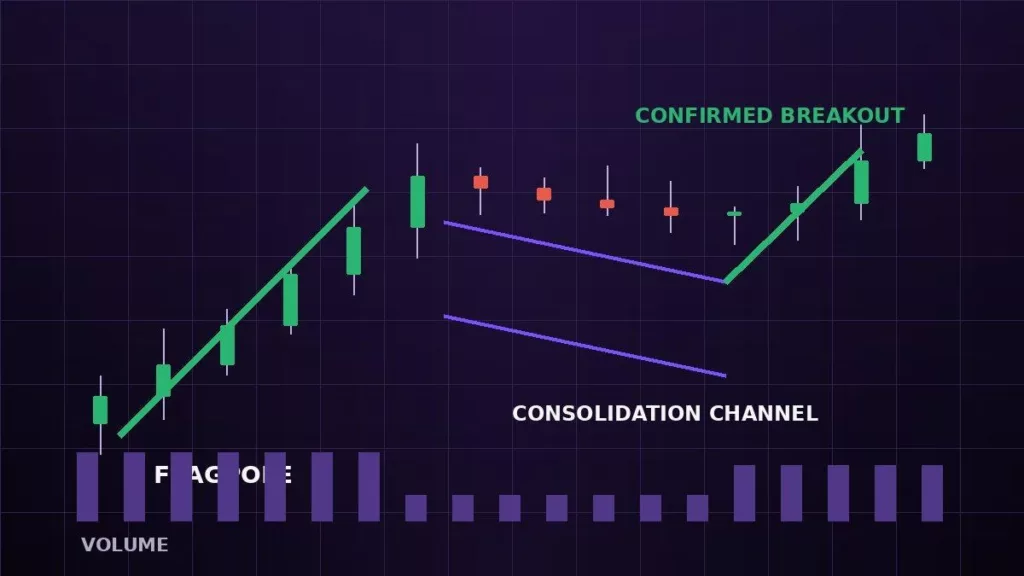
Bull and bear flag patterns share two key parts. The first is the flagpole, which represents a strong move in one direction. It reflects decisive buying in an uptrend or aggressive selling in a downtrend. The second is the flag itself. Instead of continuing in the same direction, the market enters a brief period of consolidation, moving within a relatively narrow range. In most cases, this consolidation forms a small parallel channel that moves against the prevailing trend. During an uptrend, the flag typically drifts slightly lower or sideways before the price breaks higher, forming a bull flag.
During a downtrend, the flag often moves slightly higher or sideways before the price breaks lower, creating a bear flag. You’ll find these flag chart patterns across Bitcoin, Ethereum, Solana, and many other cryptocurrencies. They also appear in stocks, forex, and commodities because they are driven by market psychology rather than a specific asset class.
The answer is simple. Markets rarely move in a straight line. After a strong rally, some traders lock in profits while others wait for a pullback before entering. During a downtrend, short sellers may take profits while bargain hunters try to buy the dip. This temporary balance between buyers and sellers slows momentum and creates a period of consolidation. Trading volume often decreases during this pause because neither side has complete control.
If buyers regain control, volume usually increases as the price breaks above the flag, supporting a possible bull flag breakout. If sellers take over, the price breaks below the flag, supporting a possible bear flag breakdown.
| Characteristic | Bull Flag | Bear Flag |
| Previous trend | Strong uptrend | Strong downtrend |
| Consolidation | Slight pullback or sideways movement | Small recovery or sideways movement |
| Typical continuation scenario | Breakout above the flag | Breakdown below the flag |
| Trading volume | Often contracts during consolidation and expands on confirmation | Often contracts during consolidation and expands on confirmation |
A bull flag starts with a clear upward flagpole, followed by a brief consolidation that usually moves sideways or slightly lower. The consolidation should remain relatively contained rather than becoming a deep, disorderly reversal.
Volume often expands during the flagpole and contracts during the pause. A close above the upper boundary, ideally supported by renewed volume, provides stronger confirmation than an intraday wick or an anticipated breakout.
Many traders wait for a confirmed close above the flag before considering a long position. Others wait for a retest of the broken boundary, which may begin acting as support. Neither approach guarantees execution or continuation.
An invalidation level is commonly placed below the lower boundary or the latest swing low. A measured-move projection can provide an illustrative target by extending the flagpole from the breakout point, but it should not replace position sizing or an exit plan.
It’s important to remember that a flag pattern is not confirmed until the breakout or breakdown occurs. Some consolidations develop into reversals, while others produce false signals. That is why disciplined traders do not trade the pattern itself, they trade the confirmation.
Not every continuation pattern appears during a rising market. When Bitcoin, Ethereum, or another cryptocurrency is already in a strong downtrend, traders often look for a bear flag pattern to assess whether selling pressure is likely to continue. Every bear flag begins with a sharp decline known as the flagpole. Instead of continuing lower immediately, the market enters a brief period of consolidation where prices move sideways or drift slightly higher inside a narrow parallel channel. At first glance, this recovery may appear to signal the beginning of a trend reversal.
However, disciplined traders know that strong downtrends are often interrupted by short-lived rallies. In many cases, the pause simply reflects profit-taking by short sellers and bargain hunting by buyers before sellers regain control and the broader downtrend resumes. Volume provides another valuable clue. During a healthy bear flag, trading activity often decreases while the market consolidates. If selling pressure returns and volume increases as the price breaks below the lower trendline, the breakdown becomes more convincing.
Like bull flags, bear flags generally produce more reliable signals when they develop within an established downtrend rather than during a sideways market.
Every bear flag tells the story of a market taking a brief pause rather than changing direction. After a sharp decline, some short sellers begin locking in profits while bargain hunters attempt to buy the dip, believing prices have reached a temporary bottom. This creates a short-lived recovery. However, buyers struggle to build enough momentum to reverse the prevailing trend. As optimism fades, sellers gradually regain control and push prices lower once again.
This is why bear flags often trap indisciplined traders. Those who mistake the recovery for the beginning of a new uptrend may enter long positions too early. When the price breaks below the flag instead of moving higher, many rush to exit, adding further selling pressure to the market.

Many traders wait for the price to close below the lower trendline before considering a short position. Waiting for confirmation helps reduce the risk of entering while the market is still consolidating. Some traders also wait for a retest. After the breakdown, the previous support level may begin acting as new resistance. If the price fails to reclaim that level, it provides additional confirmation that sellers remain in control.
A stop-loss is commonly placed above the upper boundary of the flag or above the most recent swing high. To estimate a profit target, many traders use the measured move technique by projecting the height of the flagpole downward from the breakdown point. The broader market context also matters. A bear flag forming during a strong market-wide downtrend generally carries more weight than one developing in a sideways market. Looking at higher timeframes can also help traders determine whether the pattern aligns with the prevailing trend.
Volume remains an important part of the analysis. A breakdown supported by increasing selling activity is generally considered more reliable than one that occurs on weak volume. Weak participation can increase the likelihood of a false breakdown, where prices quickly recover after briefly moving below support.For further details our guide on bear flag patterns can be referred
One of the biggest mistakes is treating every pullback as a flag pattern. Without a clear flagpole and an established trend, the price movement may simply reflect normal market volatility. Another common mistake is entering before confirmation. Anticipating a breakout or breakdown may provide a better entry price, but it also increases the risk of trading a pattern that never fully develops. It’s equally important not to ignore volume or the broader market trend. Even a well-formed flag pattern becomes less reliable if buyers or sellers fail to support the breakout with strong participation.
Finally, remember that no chart pattern should be used in isolation. Combining flag patterns with price action, support and resistance, volume analysis, and disciplined risk management generally can support better-informed trading decisions.
Also Read : crypto chart patterns
Bull and bear flag patterns are widely used continuation setups because they help traders assess whether a strong trend may be pausing rather than reversing.
Bull and bear flag patterns do not guarantee future price movements. Instead of relying on flag patterns alone, combine them with price action, trading volume, support and resistance. In addition, disciplined risk management to improve your decision-making. The goal is not to predict every market move correctly. It’s to identify high-quality trading opportunities, manage risk consistently, and make more informed decisions over time.
Continue learning on Mudrex Learn, watch the Mudrex YouTube channel. Crypto derivatives carry substantial risk; use only capital you can afford to lose.
A flag pattern is a continuation chart pattern that forms after a strong price move, followed by a brief period of consolidation before the prevailing trend resumes.
A bull flag forms after a strong uptrend and suggests that buyers may try to continue the move after consolidation.
A bear flag develops after a strong downtrend and suggests that sellers may try to continue the move following a temporary recovery.
Look for a strong flagpole, a short consolidation within parallel trendlines, declining volume during the pause. In addition, increasing volume during the breakout or breakdown.
It is another name for a flag pattern. The flagpole represents the strong price move, while the flag represents the consolidation that follows.
It can be either. A bull flag signals bullish continuation, while a bear flag signals bearish continuation.
Many traders wait for a confirmed breakout, place a stop-loss below the flag, and estimate a target using the measured move technique.
Many traders wait for a confirmed breakdown, place a stop-loss above the flag, and estimate a downside target using the measured move technique.
What confirms a flag pattern breakout?
A breakout or breakdown is generally considered more reliable when it occurs with increasing trading volume and aligns with the prevailing trend.
Volume helps confirm the strength behind a breakout or breakdown. Weak participation can increase the risk of false signals.
Many traders place a stop-loss beyond the opposite side of the flag or beyond the most recent swing high or swing low.
A common method is the measured move technique, which projects the height of the flagpole from the breakout or breakdown point.
A flag forms within parallel trendlines, a pennant forms within converging trendlines. In addition, a wedge develops inside narrowing trendlines that may signal either a continuation or a reversal depending on the context.
Yes. False breakouts and false breakdowns occur regularly, which is why traders rely on confirmation, trading volume, and risk management before entering a position.