Bitcoin Cycle Explained: Phases, Halving & Where We Are in 2026
Quick answer: The Bitcoin cycle is the roughly four-year rhythm of boom and bust that BTC has followed since 2013. It runs through four phases (accumulation, markup, distribution, and markdown) and is anchored to the halving, when new Bitcoin supply is cut in half. As of September 2026, Bitcoin trades near $77,000, down about 39% from its October 2025 all-time high of $126,296, which puts it in the later, painful part of the cycle.
Key Takeaways
Cycle Fact
Detail
Cycle length
4 years (an approximation, not a calendar)
Anchor event
Bitcoin halving (every 4 years)
Last halving
April 2024 (reward cut 6.25 to 3.125 BTC)
Next halving
April 2028
Last cycle top
$126,296 in October 2025
Where we are now
Markdown phase, 39% down from ATH
Bitcoin Cycle Details
If you are new to crypto, the Bitcoin cycle explained simply is this: Bitcoin tends to move in long waves of hope, mania, fear, and boredom, and those waves have loosely repeated every four years. This guide walks you through the phases, the halving, the key indicators, and the big question everyone is asking in 2026: is the four-year cycle still valid?
A Bitcoin cycle is the recurring loop of accumulation, bull run, peak, and bear market that has historically lined up with Bitcoin’s halving events. It is not magic and it is not a guarantee; it is a pattern tied to Bitcoin’s supply schedule, market psychology, and the way liquidity moves through risk assets.
Think of it as a mood cycle for the whole market. Prices climb until almost everyone is excited, then fall until almost everyone gives up, and the process repeats. The Bitcoin four-year cycle simply describes how long that full loop has tended to take.
Why Bitcoin Follows a Four-Year Cycle: The Halving
The engine behind the BTC halving cycle is a piece of code built into Bitcoin itself.
On April 19, 2024, Bitcoin’s fourth halving cut the block reward from 6.25 BTC to 3.125 BTC, dropping fresh daily supply from about 900 coins to 450. Roughly every four years, the reward miners earn for adding a block gets cut in half. That means new supply slows down.
The logic is simple. If demand stays the same (or grows) while new supply drops, prices tend to rise over time. That supply shock has historically kicked off each bull run. Here’s how the halvings line up:
Halving
Date
Block Reward After
First
2012
25 BTC
Second
2016
12.5 BTC
Third
2020
6.25 BTC
Fourth
April 2024
3.125 BTC
Fifth (expected)
~April 2028
1.5625 BTC
The Four Phases of a Bitcoin Cycle
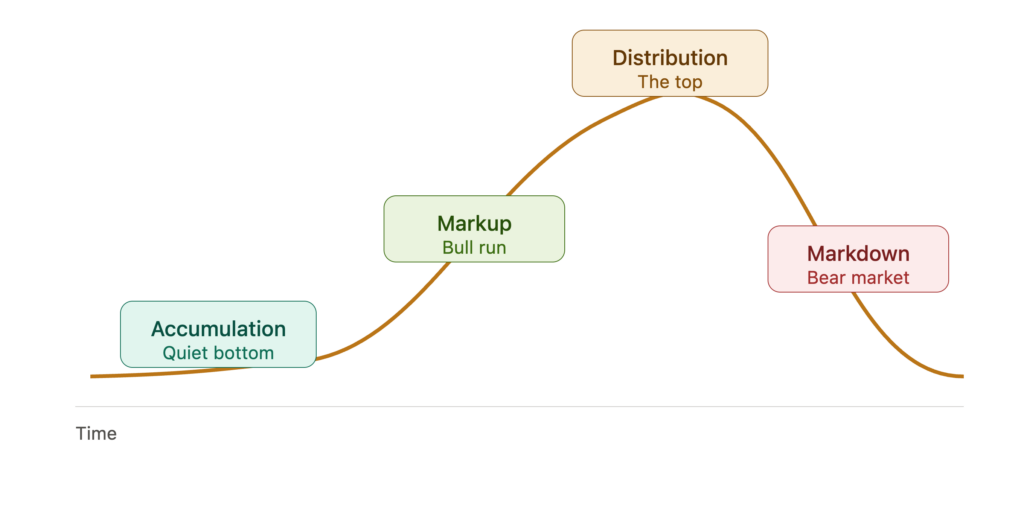
Every Bitcoin cycle explained properly comes down to four phases.
Bitcoin Cycle Phases
1. Accumulation (the quiet bottom)
Prices are low, the news is grim, and most people have stopped paying attention. Long-term believers quietly buy. This is usually the least comfortable time to invest, and often the most rewarding in hindsight.
2. Markup (the bull run)
Prices start climbing, headlines turn positive, and new buyers rush in. This is the markup phase, the exciting part where Bitcoin makes new highs and altcoins often run even harder.
3. Distribution (the top)
The rally stalls near the top. Early buyers start selling to latecomers. Excitement is at its peak, but momentum is quietly fading. This is the cycle top, and it’s notoriously hard to spot in real time.
4. Markdown (the bear market)
Prices fall, fear takes over, and the market bleeds lower for months. This is the markdown phase, and the current drawdown, with sentiment deep in extreme fear, looks a lot like the markdown phase that has followed every prior top.
One of the most useful parts of the Bitcoin cycle is its rough timing. History gives us a loose map.
Before institutional capital entered crypto, the time from the cycle low to the cycle high was typically around 1,060 days, while the time from the cycle high to the next low was around 370 days. In other words, the climb up is slow (roughly three years), and the fall is fast (roughly one year).
The halving averages four years, and the peak has tended to fall 12 to 18 months later; the four-year frame is a useful approximation, not a calendar. That last point matters. The cycle is a guide, not a stopwatch.
You can’t predict the exact top or bottom, but several on-chain tools help you read the temperature of the market. Think of these as risk gauges, not crystal balls.
Extreme fear near bottoms, extreme greed near tops
Remember: these tools identify valuation zones, not exact dates. They are risk calibration tools, not precise triggers.
Is the Four-Year Bitcoin Cycle Still Valid in 2026?
This is the question behind every Bitcoin cycle analysis right now, so let’s tackle it head-on.
The case that the cycle is weakening is real. The fourth cycle peaked at $126,296 in October 2025, a gain of just 100%, the smallest on record and the first driven by institutional ETF flows rather than retail mania. The three earlier completed cycles delivered halving-to-peak gains of roughly 7,000%, 2,900%, and 541%, so the returns are clearly shrinking each time.
Bitcoin Cycle Explained: Phases, Halving & 2026
The case that the cycle still works is also strong. As of early 2026, Bitcoin’s drop from its October high isn’t a dynamic you typically see in bull markets, which suggests the four-year pattern may continue after all. The shape still rhymes with history, just gentler.
The honest, middle view is that the cycle is evolving rather than dying. One research view argues the four-year cycle is likely still real but compressing in amplitude, meaning a cycle can exist and still become milder over time. ETFs and big institutions have smoothed the swings, but the halving and human psychology haven’t gone away.
Bitcoin Cycle Youtube
How does the Bitcoin Cycle Affect Altcoins?
Bitcoin sets the tone for the entire crypto market. When BTC rises and stabilizes near a top, money often rotates into altcoins, the famous “altcoin season.” When Bitcoin falls, altcoins usually fall harder.
So if you are watching the Bitcoin cycle, you’re also indirectly watching the setup for altcoins. The markup phase tends to lift them; the markdown phase tends to punish them more severely than Bitcoin itself.
The Bottom Line
Here’s the simple version of the Bitcoin cycle explained. Bitcoin has moved in roughly four-year waves, driven by the halving’s supply shock and swings in investor psychology, cycling through accumulation, markup, distribution, and markdown. As of September 2026, BTC sits around $77,000, well off its 2025 high, in what looks like the later part of the cycle.
But this cycle is milder than the ones before it, and ETFs have changed the game. The four-year pattern may still be real, just gentler and more macro-driven. Use it as one reference point among many, not as a guaranteed calendar. The cycle rhymes with history, right up until it doesn’t.
The Bitcoin market cycle is the recurring pattern of accumulation, bull run, peak, and bear market that has historically aligned with Bitcoin’s halving events. It’s driven by Bitcoin’s supply schedule, investor psychology, and the flow of liquidity through risk assets.
Why does Bitcoin follow a four-year cycle?
Because of the halving. Roughly every four years, Bitcoin cuts the reward miners earn in half, slowing new supply. If demand holds or grows while supply drops, prices have historically risen, kicking off a new cycle. The last halving was April 2024, and the next is expected around April 2028.
What happens after a Bitcoin halving?
Historically, the peak has arrived 12 to 18 months after a halving, followed by a bull run and then a bear market. After the April 2024 halving, Bitcoin peaked at $126,296 in October 2025 before entering a drawdown.
How long do Bitcoin bull and bear markets last?
Historically, the climb from cycle low to high took around 1,060 days (about three years), while the fall from high to the next low took around 370 days (about one year). These are averages, not exact timelines.
What signals a Bitcoin cycle bottom?
Indicators like MVRV below 1.0, negative NUPL, extreme fear sentiment, and price near the 200-week moving average have historically pointed to accumulation zones. They identify valuation zones, not exact dates, so treat them as risk gauges.
Is the four-year cycle still reliable in 2026?
It’s debated. The 2025 peak was the smallest gain on record and was driven by ETF flows rather than retail mania, suggesting the cycle is weakening. But the shape still rhymes with history. Many analysts believe the cycle is real but compressing in amplitude, not broken.
Anupam has over 3 years of experience in the crypto industry, having worked with top indian crypto exchanges. He writes about Bitcoin, altcoins, AI, and emerging tech, helping readers understand what’s driving markets and where the digital asset ecosystem is headed.