Solana Technical Analysis September 2026: RSI, MACD, Support and Resistance
Heading into mid-September 2026, SOL is fighting to hold the $100 line after a big August rally. Price is boxed in a tight range, momentum has cooled from strong to neutral, and the bigger trend is still pointing up. This Solana technical analysis breaks down the RSI, MACD, and the key support and resistance levels in plain terms, and how to trade what comes next.
BREAKING: Solana ETF cumulative inflows hit a record $1.22B. $33.5M came in Monday alone.
What Happened in August: The Breakout That Set the Stage
To read September, you have to understand August. For months, SOL was stuck in a range in the mid $70s. In August 2026 that finally broke.
SOL ran from the mid $70s up to highs near $107 to $110, a strong move backed by real network growth and fresh money flowing into Solana ETFs. The token even earned formal recognition as a core ETF asset alongside Bitcoin and Ethereum. That breakout flipped the whole structure bullish and pushed SOL well above its key moving averages.
When
Price
Note
Early August
Mid $70s
Stuck in range
August high
$107 to $110
Breakout peak
Early Sept
Around $100
Holding the gains
Mid Sept
$96 to $106
Digesting, range-bound
Solana Price Updates
The takeaway: the breakout was real and powerful, but it ran fast. September is the month where SOL decides whether $100 becomes a floor or a ceiling.
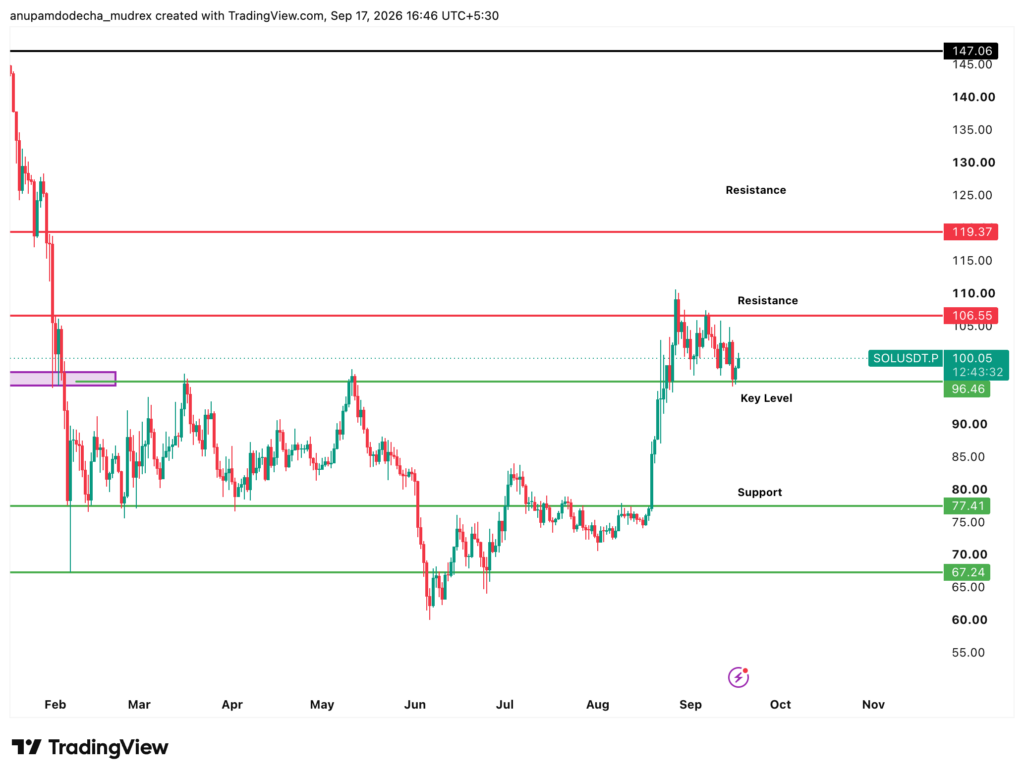
Solana Price Chart and Key Levels
Solana Technical Analysis: RSI Has Cooled to Neutral
RSI is a simple momentum gauge from 0 to 100. Think of it like a speedometer. Above 70 means the move is running hot. Below 30 means it is running cold. The middle, around 50, is neutral.
SOL started September in the low-to-mid 60s, which is healthy bullish momentum but not extreme. Since then it has cooled into the 51 to 53 zone.
Stage
RSI
In plain terms
Early Sept
60 to 65
Healthy, bullish
Mid Sept
51 to 53
Neutral, no clear signal
Solana Technical Analysis RSI
Trader read: A neutral RSI means SOL is neither overbought nor oversold, so there is room to move either way without an immediate reversal warning. This is a coiling phase, not a top or a bottom. Watch for RSI pushing back above 60 as a sign buyers are taking control again, or dropping under 45 as a warning that sellers are gaining.
Solana Technical Analysis: MACD Momentum Has Weakened
MACD is another momentum tool. In simple terms: when momentum is rising, the trend has fuel. When it fades, the trend is running out of steam.
Early in September, SOL’s momentum was still positive. But it has since weakened. The MACD line has slipped below its signal line, and momentum has turned slightly negative in recent daily readings.
Period
Momentum
What it meant
Early Sept
Positive
Buyers still in control
Mid Sept
Fading, slightly negative
Short-term buying pressure cooling
Solana Technical Analysis MACD
Trader read: This is fading short-term momentum inside a bigger uptrend, not a full reversal. For renewed upside, you want to see the MACD line cross back above its signal line. Until then, this signal leans cautious and supports the range-bound read.
Solana Support and Resistance Levels
Support and resistance are just the floor and the ceiling of price. Support is where buyers tend to step in. Resistance is where sellers show up. These are the levels every Solana technical analysis leans on. Right now the fight is centered on the $100 mark.
Type
Level
Why it matters
Ceiling
$100.80 to $102
Immediate resistance, the $100 battleground
Ceiling
$104 to $107
Next cluster to clear
Ceiling
$108 to $110
Recent swing high, the big wall
Above
$120+
Opens up on a clean break above $110
Floor
$98.90 to $99.50
Immediate support, near the 20-day average
Floor
$96 to $98
Key zone to hold
Floor
$93 to $95
Stronger support, 50-day average
Deep floor
$89 to $92
Near the 200-day average
Solana Key Support and Resistance Levels
Daily pivots have clustered around $99.60 to $101.40 depending on the session.
Trade plan: $100 is the psychological battleground. Holding above the 50-day average (around $89 to $93) keeps the recovery intact. A clean break and close above $110 opens the door toward $120. On the downside, a decisive drop below $95 to $96 raises the risk of a slide toward lower supports. Buyers like dips toward $96 to $98 with a stop below $95.
Solana Chart Patterns and Trend
The bigger picture still favors bulls, even with the short-term pause.
Timeframe
What it shows
Meaning
Weekly
Broke the multi-month range
Bullish structure
Daily
Above 50-day and 200-day averages
Uptrend intact
1-hour
Short-term averages inverted
Near-term hesitation
Solana Chart Patterns
The friction is clear: the daily and weekly charts are bullish, while the very short-term charts show hesitation right under $100. That gap between timeframes is exactly why SOL is chopping sideways rather than trending. Volatility stays elevated, with daily ranges often around 4%.
Is Solana Bullish or Bearish?
Both, depending on how far out you look. On the bigger picture the Solana technical analysis leans bullish, but the short term is a coin toss until a level breaks.
Timeframe
Bias
Why
Weekly
Bullish
Broke the range, above key averages
Daily
Neutral to bullish
Holding above moving averages, momentum fading
Short term
Sideways
Stuck around $100, mixed signals
SOL Trend Bias
As of September 17, SOL is trading near $100, right in the middle of its range, exactly the consolidation the early-September charts pointed to.
How do I trade Solana using technical analysis? Use RSI to see if momentum is hot or cold, MACD to check if that momentum is building or fading, and support and resistance to plan your entries, exits, and stops. In September 2026, a neutral RSI and a fading MACD point to a range, so buyers watch the $96 to $98 floor and breakout traders watch the $110 ceiling.
How to buy Solana using INR? You can buy Solana (SOL) directly with INR on Mudrex. Complete KYC, add INR, select SOL, enter your amount, and place your order.
What are Solana’s current support and resistance levels? As of mid-September 2026, immediate resistance is $100.80 to $102, with the bigger wall at $108 to $110. Immediate support is $98.90 to $99.50, with stronger support at $93 to $95 near the 50-day average. Holding above $95 to $96 keeps the recovery intact.
What does Solana’s RSI indicate? SOL’s RSI started September in the low-to-mid 60s and cooled to a neutral 51 to 53. That means it is neither overbought nor oversold, leaving room to move either way with no strong signal yet from this indicator.
What does the MACD signal for SOL? MACD was positive early in September but has since weakened, with the line slipping below its signal and momentum turning slightly negative. This points to fading short-term buying pressure inside a still-bullish bigger trend. A recross above the signal line would confirm renewed upside.
Is Solana bullish or bearish right now? Bullish on the daily and weekly charts after breaking a multi-month range and holding above its 50-day and 200-day averages, but neutral and range-bound in the short term while it fights to hold $100.
Which timeframe is best for Solana technical analysis? Longer-term traders use the daily and weekly charts for the main trend; short-term traders use the 1-hour and 4-hour charts for timing. In September 2026 the daily looks bullish while the 1-hour shows hesitation, so your timeframe changes the read.
Anupam has over 3 years of experience in the crypto industry, having worked with top indian crypto exchanges. He writes about Bitcoin, altcoins, AI, and emerging tech, helping readers understand what’s driving markets and where the digital asset ecosystem is headed.