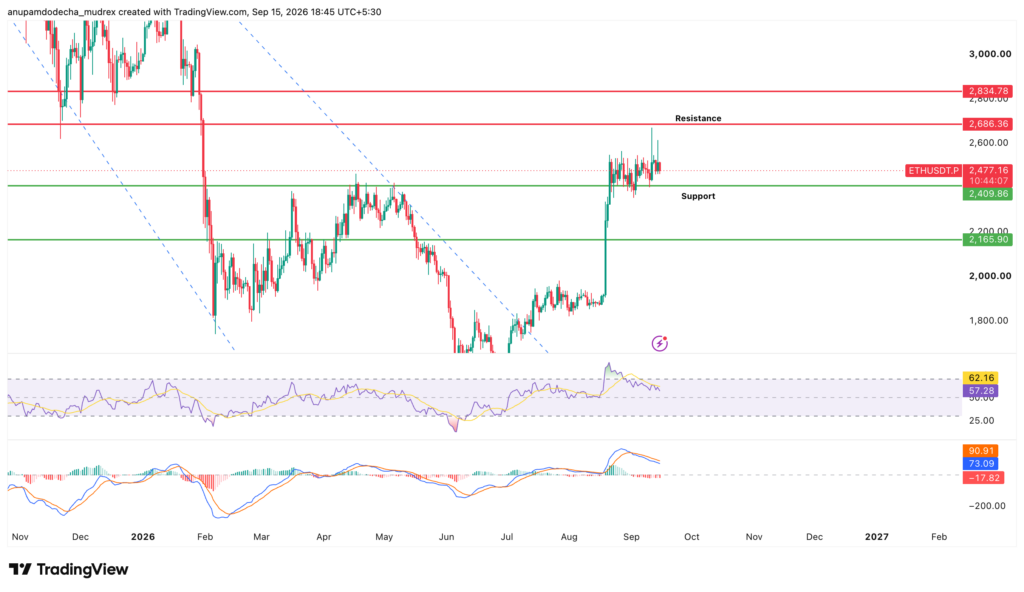
Ethereum Technical Analysis September 2026: RSI, MACD, Support and Resistance
Heading into September 2026, ETH is holding onto a big August breakout and trying to prove it was real. Price is stuck between a firm floor near $2,438 and a stubborn ceiling at $2,550, with momentum now cooled from overheated to neutral. This Ethereum technical analysis breaks down the RSI, MACD, and the key support and resistance levels in plain terms, and how to trade what comes next.
What Happened in August: The Breakout That Set the Stage
To read September, you have to understand August. For almost a year, ETH kept getting rejected at the same downtrend line. In mid-August 2026 that finally cracked.
ETH ran from around $1,860 up to a peak near $2,545 to $2,565, a jump of more than 31% on the month. It closed August around $2,467. The move was fueled by strong money flowing into Ethereum ETFs and a wider crypto rally, with Bitcoin climbing at the same time. Importantly, it produced the first higher high in this cycle, something earlier attempts failed to do.
When
Price
Note
July close
$1,860
Before the breakout
Mid Aug peak
$2,545 to $2,565
Top, overheated
Aug close
$2,467
First higher high of the cycle
Mid Sept
$2,450 to $2,530
Holding the gains
ETH Price Updates
The takeaway: the breakout was real, but it ran too far too fast. September is the month where the market decides whether those gains stick.
Ethereum Price Chart
Ethereum Technical Analysis: RSI Has Cooled Off
RSI is a simple momentum gauge from 0 to 100. Think of it like a speedometer. Above 70 means the move is running hot. Below 30 means it is running cold.
During the August surge, RSI spiked to around 86, which is very hot and a clear sign the rally was overstretched. Since then it has calmed down. Heading through September, RSI has eased back into the neutral zone, sitting around 58 to 61.
Stage
RSI
In plain terms
Aug 21 peak
86
Very hot, overstretched
Late August
68 to 71
Cooling off
September
58 to 61
Neutral, healthy
Ethereum Technical Analysis RSI
Trader read: This cool-down is actually good news for bulls. The rally burned off its excess heat without price crashing. A neutral RSI means there is room to move up again if buyers step in, but no strong signal either way yet. Watch for RSI turning back up above the mid-60s as a sign momentum is returning.
Ethereum Technical Analysis: MACD Momentum Has Flattened
MACD is another momentum tool. In simple terms: when momentum is rising, the trend has fuel. When it flattens, the trend is running out of steam.
Through the August rally, ETH’s momentum was strong and rising, which backed the breakout. As the month ended and September began, that momentum flattened out. This is a pause, not a reversal.
Period
Momentum
What it meant
Mid August
Rising, strong
Rally had fuel
Late August
Positive but slowing
Bullish, losing steam
September
Flat
Move pausing, waiting for direction
Ethereum Technical Analysis MACD
Trader read: A flat MACD is the market catching its breath. Paired with the neutral RSI, it says ETH is coiling inside a range rather than trending. Wait for momentum to clearly turn up (to confirm the next leg higher) or clearly turn down (to warn of a deeper drop) before committing.
Ethereum Support and Resistance Levels
Support and resistance are just the floor and the ceiling of price. Support is where buyers tend to step in. Resistance is where sellers show up. These are the levels every Ethereum technical analysis leans on. Right now the whole battle is packed between $2,438 and $2,550.
Type
Level
Why it matters
Ceiling
$2,550
Main wall, lines up with the 50-week average, rejected repeatedly
Ceiling
$2,600 to $2,660
Next targets if the wall breaks
Ceiling
$2,920
Bigger upside target if the breakout holds
Floor
$2,438
Key line, a Fibonacci support that must hold
Floor
$2,400 to $2,405
Old ceiling now a floor, near the 20-day average
Floor
$2,220
Deeper support if $2,438 breaks
Deep floor
$2,000
Where things get shaky
Ethereum Support and Resistance
Trade plan: $2,438 is the line in the sand. As long as ETH holds a weekly close above it, the September outlook stays bullish, with $2,920 as the upside target (roughly 19% higher). Lose $2,438 on a weekly close and the picture weakens fast, opening the door to $2,220 and then $2,000. The $2,550 ceiling is the other key level: clear it and the path higher opens up.
Ethereum Chart Patterns and Trend
The bigger picture still favors bulls, even with the short-term pause.
Timeframe
What it shows
Meaning
Weekly
Broke the year-long downtrend
First higher high of the cycle
Daily
Sitting on key support
Consolidating after the run
4-hour
Range between $2,438 and $2,550
Waiting for a breakout
ETH Chart Patterns
Analyst Ted Pillows expects more sideways chop and a small dip before any genuine reversal, since ETH keeps failing at $2,550 and too many traders are crowded into longs. He marks $2,200 as first support and $2,800 as the next big resistance. Worth noting: one whale opened a large 10x long on ETH with a liquidation price near $2,241, so the $2,200 to $2,240 zone matters on the downside.
Is Ethereum Bullish or Bearish?
Both, depending on how far out you look. On the bigger picture the Ethereum technical analysis leans bullish, but the short term is a coin toss until a level breaks.
Timeframe
Bias
Why
Weekly
Bullish
Broke the downtrend, printed a higher high
Daily
Neutral to cautious
Mixed signals, resting on support
Short term
Sideways
Stuck between $2,438 and $2,550
ETH Trend Bias
As of September 15, ETH is trading around $2,500, right inside that range, exactly the consolidation the late-August charts pointed to.
Educational only, not financial advice. Crypto is volatile. Do your own research.
FAQs
How do I trade Ethereum using technical analysis? Use RSI to see if momentum is hot or cold, MACD to check if that momentum is building or fading, and support and resistance to plan your entries, exits, and stops. In September 2026, a neutral RSI and a flat MACD point to a range, so buyers watch the $2,438 floor and breakout traders watch the $2,550 ceiling.
What are Ethereum’s support and resistance levels now? As of mid-September 2026, the key floor is $2,438 (with $2,400 below it) and the main ceiling is $2,550. Holding $2,438 keeps the outlook bullish toward $2,920; losing it opens the door to $2,220 and then $2,000.
What does Ethereum’s RSI indicate? RSI spiked to around 86 during the August breakout, very overheated, then cooled to a neutral 58 to 61 through September. That means the rally burned off its excess heat and now has room to move either way, with no strong signal yet.
What does the MACD signal for ETH? MACD showed strong, rising momentum during the August rally, then flattened as September began. A flat MACD is a pause, not a reversal, and fits the picture of ETH resting inside a range.
Is Ethereum bullish or bearish right now? Bullish on the weekly chart after breaking a year-long downtrend and printing a higher high, but neutral and range-bound in the short term while it sits between $2,438 support and $2,550 resistance.
Which timeframe is best for Ethereum technical analysis? Longer-term traders use the daily and weekly charts for the main trend; short-term traders use the 1-hour and 4-hour charts for timing. In September 2026 the weekly looks bullish while the shorter charts show a range, so your timeframe changes the read.
Anupam has over 3 years of experience in the crypto industry, having worked with top indian crypto exchanges. He writes about Bitcoin, altcoins, AI, and emerging tech, helping readers understand what’s driving markets and where the digital asset ecosystem is headed.