XRP Technical Analysis September 2026: RSI, MACD, Support and Resistance
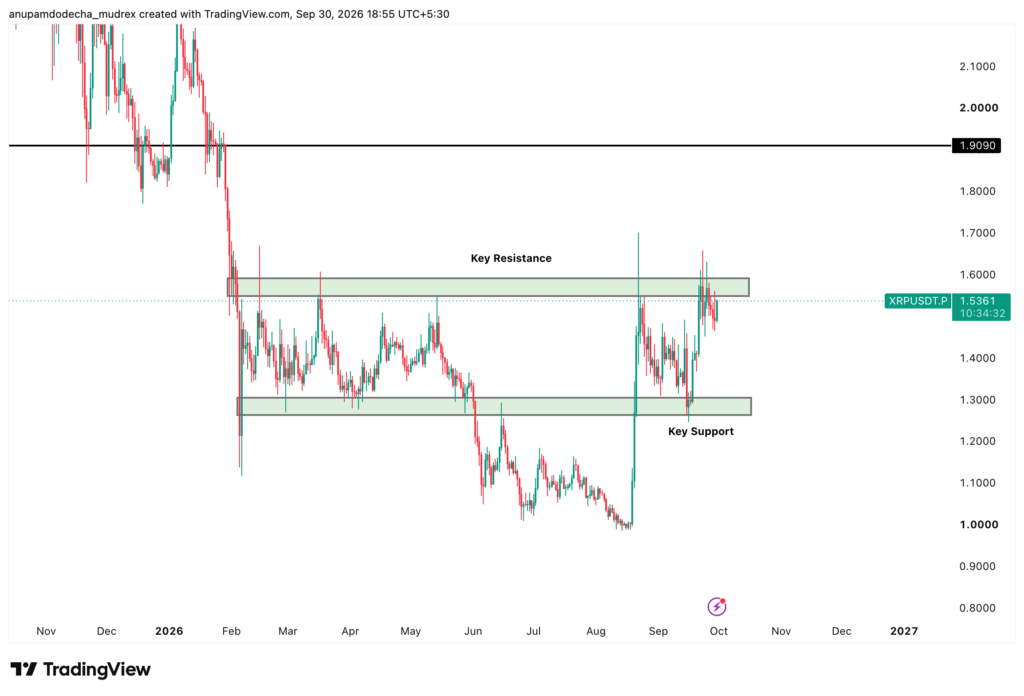
Quick answer: XRP trades around $1.50 as of September 30, 2026, coiling in a tight range after recent volatility. The XRP technical analysis picture is cautiously bullish: price sits above its rising 50-day and 200-day moving averages, RSI is neutral-to-positive, but momentum (MACD) has flattened. The key zone to watch is $1.54–$1.55, a clean daily close above it opens the path to $1.60, while a drop below $1.35 would weaken the setup.
XRP Price Chart
Signal
Reading
Meaning
Trend
Above 50 & 200-day averages
Constructive
RSI
~56–58
Neutral, room to rise
MACD
Flat, near signal line
Momentum paused
Key resistance
$1.54–$1.55, then $1.60
Breakout zone
Key support
$1.35 (50-day), $1.28 (200-day)
Trend floors
Key Takeaways
If you trade XRP, this XRP technical analysis breaks down the RSI, MACD, support and resistance, and the news catalysts on the horizon, so you can read the chart for yourself.
Where XRP Stands Right Now
XRP is trading around $1.49 to $1.51, consolidating after a recent burst of volatility. The bigger trend still leans positive, mainly because the price is holding comfortably above two important trend lines: the 50-day average (around $1.35) and the 200-day average (around $1.28).
Consolidation like this often happens after a strong move. The price pauses, catches its breath, and traders wait for the next catalyst to decide direction. Right now XRP is pressing near the top of its recent range, which makes the $1.54 to $1.55 zone the line everyone is watching.
Metric
Value
Price
~$1.50
50-day average
~$1.35
200-day average
~$1.28
Immediate resistance
$1.52–$1.55
Immediate support
$1.46–$1.48
Key Info
The takeaway for this XRP technical analysis: the structure is bullish as long as those moving averages hold, but momentum has stalled, so it’s a decision zone rather than a confirmed breakout.
XRP RSI Analysis
RSI (Relative Strenght Index) measures whether an asset is overbought or oversold. It runs from 0 to 100, above 70 is typically overbought, below 30 oversold, and the middle is neutral.
XRP’s daily RSI sits around 56 to 58. That’s neutral-to-mildly bullish: it’s above the halfway mark, which favors buyers, but well below the 70 overbought zone. In practice, that means XRP still has room to climb before it looks stretched, and there’s no sign of exhaustion at current levels.
Shorter timeframes (the 1-hour and 4-hour charts) show RSI in a similar mid-range, which keeps the near-term picture constructive without flashing any warning signs.
XRP MACD Analysis
The MACD (Moving Average Convergence Divergence) tracks momentum and trend direction. When the MACD line crosses above its signal line, it’s a bullish sign; when it crosses below, it’s bearish.
Right now XRP’s MACD is essentially flat, pinned very close to its signal line, with the histogram hovering near zero. In plain terms, momentum has paused after the last move up, rather than reversing. It’s neither clearly accelerating nor rolling over.
This is what makes the current setup a “wait and see.” Two things would tip the balance:
Bullish: the MACD line pushing back above the signal line, plus RSI breaking above 60, would support more upside.
Bearish: the MACD rolling into negative territory would favor a pullback toward the moving averages.
Support and resistance are the price zones where XRP has historically struggled to fall below or push above. They’re the map traders use to plan entries, exits, and stops.
Type
Level
Role
Extension resistance
$1.62
Upper band target
Strong resistance
$1.60
Key psychological level
Immediate resistance
$1.52–$1.55
Recent highs, breakout zone
Immediate support
$1.46–$1.48
First cushion
Support
$1.44
20-day average
Key support
$1.35–$1.36
50-day average
Major support
$1.28
200-day average
Deeper support
$1.23–$1.25
Structural floor
XRP Key Levels
Reading it simply: a clean daily close above $1.54 to $1.55 clears the way toward $1.60. If XRP stalls here and momentum weakens, it could rotate back toward the 50-day average near $1.35. A break below $1.35 would dent the bullish structure, and a break below $1.28 would flip the intermediate trend from positive to negative.
Is XRP Bullish or Bearish Right Now?
Putting the pieces together, XRP leans cautiously bullish, but it’s at a decision point.
The bullish evidence: price is above both major moving averages, RSI is positive with room to run, the ADX reading shows a real trend is present, and many daily indicator suites currently read “Strong Buy” because of that alignment above key averages.
The caution: the flattened MACD means momentum has paused, so this isn’t a high-conviction breakout yet. It’s a coil near range highs waiting for a trigger. Bulls want a close above $1.55; bears want a break below $1.35.
Technical levels rarely break on their own, they usually need a catalyst. Several are lined up.
A Brazilian central securities depository has started using the XRP Ledger to record real securities ownership on a public blockchain for the first time, beginning with certain fund shares. It’s one of the more concrete real-world tokenization milestones for the network.
On the protocol side, an upgrade that lets multiple transactions bundle together (important for institutional settlement) is in its voting window, with possible activation around October 9 if validator support holds. There’s also a monthly token escrow release on October 1, though historically most of that is typically re-locked rather than sold.
Finally, spot XRP ETFs are live and have seen continued net inflows, holding well over a billion XRP combined. That gives XRP a steady, regulated source of institutional demand, a structural support beneath the chart. A major industry conference is also scheduled for October, which can bring announcements.
Watch the $1.54 to $1.55 resistance alongside the October 1 escrow and the October 9 upgrade window, any of these could be the spark that decides the next move.
How to Trade and Invest in XRP in India
On Mudrex, you can get exposure to XRP in two ways, depending on your style:
Open the Mudrex app and complete your KYC.
Fund your account in INR.
Search for XRP.
If you want to buy and hold, use Spot. If you want to actively trade the price moves in either direction, use perpetuals (perps), which let you go long or short with leverage without owning the token.
Spot suits investors; perps suit active traders using technical analysis to trade both directions. Because XRP can be volatile, use stop-losses and manage your position size rather than chasing a level. This is educational information, not investment advice.
The Bottom Line
This XRP technical analysis points to a cautiously bullish but paused market. XRP is holding above its key moving averages with a healthy RSI, which keeps the trend constructive, but the flat MACD says momentum is resting. The chart is coiling near $1.50, waiting for a catalyst.
The levels to watch are simple: a daily close above $1.54 to $1.55 opens the door toward $1.60, while a break below $1.35 would weaken the bullish case and $1.28 would flip the trend. With ETF inflows, the Brazil tokenization news, and upcoming network upgrades all in play, the next few weeks could provide the trigger. Trade the levels, not the hype, and always use a stop.
FAQs
How do I trade XRP using technical analysis?
Use support and resistance to plan entries and exits, and confirm with indicators like RSI and MACD. For XRP now, a daily close above $1.54–$1.55 with rising momentum favors longs, while a break below $1.35 favors caution. Always set a stop-loss to manage risk.
What are XRP’s current support and resistance levels?
Immediate resistance sits at $1.52–$1.55, then $1.60. Immediate support is $1.46–$1.48, with stronger support at the 50-day average near $1.35 and major support at the 200-day average near $1.28.
What does XRP’s RSI indicate?
XRP’s daily RSI is around 56–58, which is neutral-to-mildly bullish. It’s above the midpoint, favoring buyers, but well below the 70 overbought level, so there’s room to move higher without signaling exhaustion.
What does the MACD signal for XRP?
The MACD is currently flat and close to its signal line, meaning momentum has paused rather than reversed. A move back above the signal line would support more upside, while a roll into negative territory would favor a pullback.
Is XRP bullish or bearish right now?
XRP leans cautiously bullish. It’s trading above its key moving averages with a positive RSI, but the flat MACD keeps it in a decision zone rather than a confirmed breakout. Bulls want a close above $1.55; bears want a break below $1.35.
Which timeframe is best for XRP technical analysis?
It depends on your style. Day traders focus on 1-hour and 4-hour charts, while swing and long-term traders rely on the daily and weekly charts. The daily chart is the most widely watched for balancing noise and reliable signals.
Which indicators work best with XRP?
No single indicator is enough. A common combination is moving averages for trend, RSI for momentum, MACD for confirmation, and support/resistance for entries and exits. Volume helps confirm whether a breakout is real.
How should traders use stop-loss levels when trading XRP?
Place stops just beyond a key level so you’re proven wrong quickly if the trade fails. For a long near $1.50, a stop below the 50-day average around $1.35 is one approach. Size positions so a single loss stays small relative to your capital.
Disclaimer: This article is for educational purposes only and is not investment advice. Prices are volatile and can fall as well as rise. Do your own research before investing. Invest only what you can afford to lose.
Anupam has over 3 years of experience in the crypto industry, having worked with top indian crypto exchanges. He writes about Bitcoin, altcoins, AI, and emerging tech, helping readers understand what’s driving markets and where the digital asset ecosystem is headed.