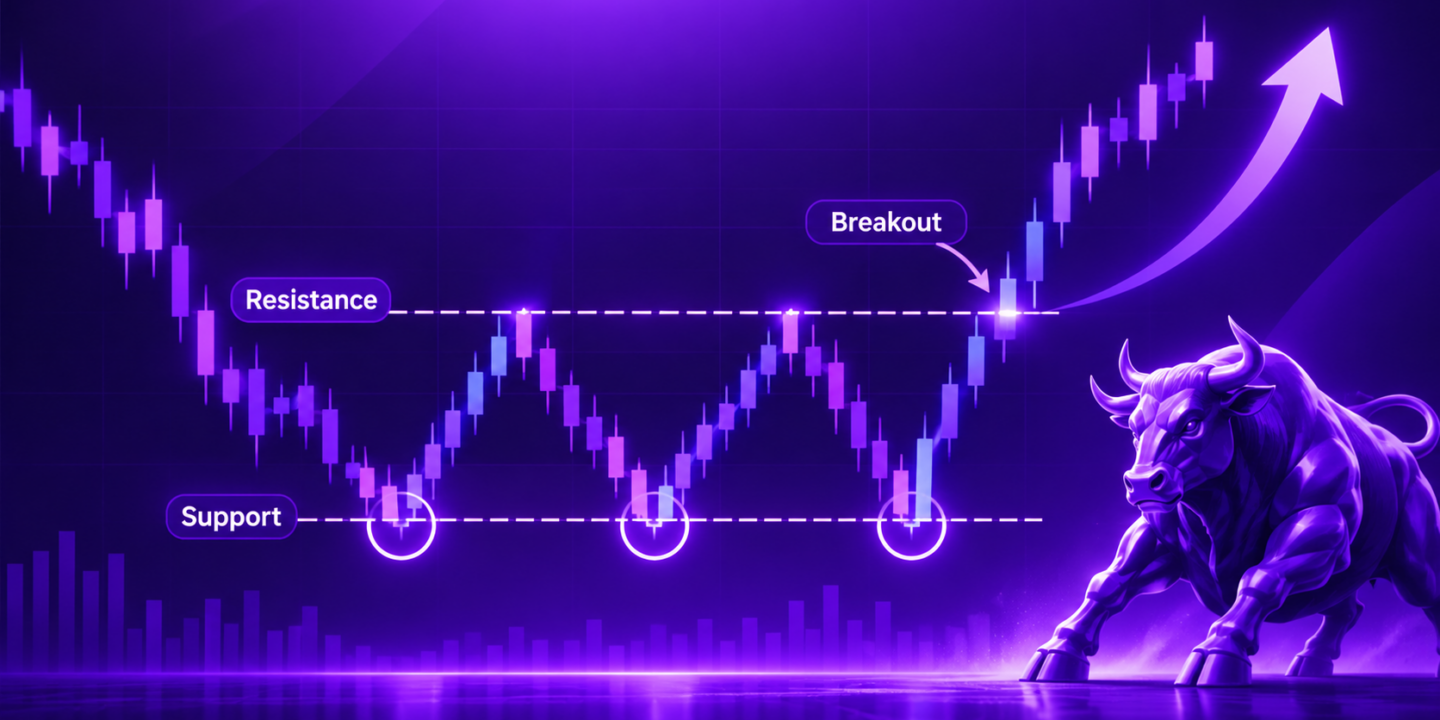
A triple bottom pattern is a bullish reversal formation where price falls to roughly the same level three times, fails to break lower on each attempt, then breaks out above the highs in between. It tells you a support level has survived three attacks and that sellers have run out of ammunition. The signal only goes live once price closes above the highest peak inside the pattern.
This setup is built for swing traders and position traders. A triple bottom pattern usually takes weeks to form on a daily chart, so it is not a scalping tool. If you hold positions for days or weeks, read 4 hour and daily charts, and want a setup with a clean invalidation level, it belongs in your toolkit.
Day traders will spot it on 15 minute charts now and then. At that scale the signal gets noisy fast, and most of what looks like a triple bottom pattern on a 15 minute chart is just three candlewicks in a choppy range.
This guide covers how the pattern forms, how to identify it, where to place key levels, and what Thomas Bulkowski’s analysis of over 2,500 patterns reveals about its performance.
What Is the Triple Bottom Pattern?
In technical analysis, a triple bottom pattern is a reversal formation made of three valleys that bottom at or near the same price, separated by two peaks. Think of it as a floor that gets tested three times and does not give way.
Each failed attempt to break lower tells the market something. Buyers are willing to defend that price. By the third test, sellers who wanted out have mostly already sold, and the next move of any size is more likely to be up than down.
Two rules keep most false positives out:
Price must be falling into the pattern, and should not close below the first bottom at any point while the pattern builds.
Nothing counts until confirmation. Price has to close above the highest peak between the valleys. Bulkowski is blunt about this: triples are rare, and price often just keeps falling without ever confirming.
That rarity is part of the appeal. Three bottoms seldom line up neatly, so when they do, the structure is worth paying attention to.
Anatomy of the Triple Bottom Pattern
Part
What to look for
Three valleys
All three bottom near the same price. Small variation between them is fine
Two peaks
They separate the valleys. The higher of the two is your breakout level
Breakout level
The highest peak inside the pattern. Confirmation means a close above it
Pattern height
Highest peak minus lowest valley. This sets your target
Prior trend
Downward into the pattern, with no close below the first bottom
Take the example on the chart above. Bitcoin falls to $60,200, bounces to $66,000, falls to $59,800, bounces to $64,500, then falls to $60,100 before turning up again.
Breakout level: the higher peak, so $66,000
Lowest valley: $59,800
Pattern height: $66,000 minus $59,800 = $6,200
That height is about 10% of the price, and it drives every other number in the trade.
Why the Triple Bottom Pattern Forms
The price line shows you what happened. Volume shows you why.
First test. Price hits support and heavy selling meets heavy buying. Buyers win, barely. Volume is high because both sides are active.
Second test. Price comes back down. Fewer sellers show up this time, because many of the people who wanted out got out on the first test. Volume is lighter.
Third test. Support is hit again and the selling barely registers. Nobody left wants to sell at this price. Volume is thin.
Breakout. With sellers exhausted, it takes very little buying to push price through the ceiling. Volume spikes as buyers who were waiting on the sidelines pile in.
Bulkowski’s research found that volume trends downward through the pattern 61% of the time, which matches that story exactly. Fading volume into the third bottom is a quiet vote of confidence.
How to Identify the Triple Bottom Pattern
On timeframes, use the daily chart to find them and the 4 hour chart to time the entry. Anything below 1 hour throws up too many shapes that look right and behave like noise. Bulkowski also found that patterns formed after a decline of six months or less perform best, so a fresh selloff beats a two year bear market.
Another pattern worth understanding is thebullish hammer, which can signal a shift in momentum from sellers to buyers.
Triple Bottom Pattern vs Three Lookalikes
Three other formations get mistaken for this one, and each behaves differently.
Pattern
Shape
Key difference
Bias
Triple bottom
Three lows at the same level
All three valleys sit at roughly one price
Bullish
Double bottom
Two lows at the same level
One fewer test, so slightly weaker evidence
Bullish
Head and shoulders bottom
Three lows, middle one deepest
The middle valley breaks below the other two
Bullish
Rectangle bottom
Several lows and highs in a box
Flat ceiling as well as a flat floor
Either way
The one that catches people out is the head and shoulders bottom. If the middle valley is clearly the lowest of the three, that is what you have. It is still bullish, but the measurements and the neckline work differently.
How to Trade the Triple Bottom Pattern
Carrying the same numbers forward: breakout level $66,000, lowest valley $59,800, pattern height $6,200.
Entry
Buy when a candle closes above $66,000. Not when price touches it intraday, and not in anticipation. An intraday poke above the level that closes back below is one of the most common ways to lose money on this pattern.
The lower risk alternative is to wait for the throwback, which the next section covers.
Stop loss
You have two realistic choices, and the arithmetic should decide it.
Below the whole pattern, around $59,300. Technically correct, because the pattern is only truly dead if price falls under the lowest valley. But that is $6,700 of risk per unit.
Below the nearer peak, around $63,800, just under the $64,500 second peak which now acts as support. That cuts the risk to $2,200.
On a pattern this tall, the full width stop leaves you risking $6,700 to make $4,600. That is a 1:0.7 trade, and no amount of pattern reliability fixes those odds.
Target and the 74% measure rule
Most articles tell you to add the full pattern height to the breakout and call it a target. Bulkowski’s own measure rule does not say that. He multiplies the height by the percentage of patterns that actually reach their target, which for triple bottoms is 74%.
The second number is the one to plan around. The first is where you might get lucky.
Level
Price
Working
Entry
$66,000
Close above the highest peak
Stop loss
$63,800
Just under the $64,500 second peak
Risk
$2,200
$66,000 minus $63,800
Target
$70,600
$6,200 height × 74%, added to $66,000
Reward
$4,600
$70,600 minus $66,000
Risk reward
1:2
$2,200 risked for $4,600
The Throwback, and Why It Is Often the Better Entry
Here is the number almost nobody mentions. After a triple bottom breakout, price comes back to retest the breakout level 65% of the time before continuing. Bulkowski calls this a throwback.
Two things follow from that.
Do not panic when price dips back toward your entry a few sessions in. That is the base case, not a failure.
Consider waiting for it. Buying the retest instead of the breakout gives you a tighter stop and a better entry price, at the cost of missing the 35% of setups that never look back.
One caveat worth knowing: Bulkowski’s data also shows that patterns which throw back tend to produce weaker moves afterwards than those that run straight up. The retest is a cheaper entry, not a stronger signal.
What Confirms the Triple Bottom Pattern
Four things turn a shape into a setup.
The close above the highest peak. This is not optional. Without it there is no pattern.
Volume on the breakout. A breakout on thin volume is a candidate for a quick reversal.
Fading volume into the third bottom. Lighter selling on each test is the pattern working as advertised.
Momentum. RSI turning up from oversold, or making higher lows while price makes equal lows, supports the reversal case.
How Reliable Is the Triple Bottom Pattern?
Measure
Result
Overall performance rank
12 out of 39 chart patterns
Break even failure rate
13%
Average rise after breakout
46%
Throwback rate
65%
Percentage reaching the price target
74%
Sample size
More than 2,500 patterns
Source: Thomas Bulkowski, Encyclopedia of Chart Patterns, bull market figures published on thepatternsite.com. Ranks run 1 to 39, with 1 the best.
Advantages and Limits
Works in your favour
Works against you
The invalidation level is obvious, so risk is easy to define
The pattern is rare, so you will wait a long time between setups
Three tests of support is stronger evidence than one or two
Tall patterns force wide stops, which hurts the risk reward
Strong historical payoff when the breakout holds
Price often keeps falling and never confirms the pattern at all
Works on any timeframe and any asset
65% of breakouts throw back, which shakes out impatient traders
Mistakes That Ruin a Triple Bottom Pattern Trade
Entering before confirmation. Three bottoms without a close above the highest peak is not a pattern. It is a guess.
Drawing it after a long uptrend. Bulkowski specifically warns that triple bottoms appearing after an extended rally produce disappointing moves.
Calling a head and shoulders bottom a triple bottom. Check whether the middle valley is the deepest before you measure anything.
Using the naive 100% target. It overshoots by design. Only 74% of patterns reach even the adjusted target.
Exiting on the throwback. Two thirds of breakouts retest. If your stop sits right under the breakout level, you will be stopped out of good trades repeatedly.
Why Trade in Crypto or Tokenised Stocks?
The pattern reads the same in every market. What changes is the market you apply it in.
Factor
Indian equities
Crypto and tokenised assets
Market hours
9:15 AM to 3:30 PM IST, weekdays
24×7, including weekends
Going short
Mostly via F&O, limited stock coverage
Long or short on most pairs through futures
Starting capital
Lot sizes can be large
Fractional sizing, INR margin
Global access
Restricted for most retail investors
Global assets from India in one account
For a pattern that takes weeks to build, round the clock trading matters more than it sounds. A breakout that happens on a Sunday morning is tradable instead of being a Monday gap you have to chase. Tokenised assets extend the same access to global names in sizes a retail account can actually hold.
Learn more aboutdifferent candlestick patternsand how traders use them to identify potential market trends and reversals.
The Short Version
The triple bottom pattern marks a floor that sellers attacked three times and could not break. It is one of the better ranked reversal formations on record, with a 13% break even failure rate and a 46% average rise, but it only exists once price closes above the highest peak inside it.
Find three valleys at the same level. Wait for the close above the ceiling. Set your stop under the nearer peak so the risk reward is at least 1:2. Expect a retest, because two thirds of the time you will get one.
Put it on a live chart
Pull up a daily BTC or ETH chart and find the last support level that held three times. Then trade long or short with INR margin on Mudrex Futures.
The triple bottom pattern is a bullish reversal chart formation made of three valleys that bottom at or near the same price, separated by two peaks. It signals that a support level has held under three separate attacks and that selling pressure is exhausted. It confirms only when price closes above the highest peak inside the pattern.
How do you identify the triple bottom pattern?
Look for a downtrend leading into the pattern, three distinct valleys at roughly the same price, two clear peaks separating them, volume that fades from the first bottom to the third, and finally a close above the highest peak. If the middle valley is the deepest, it is a head and shoulders bottom instead.
Is the triple bottom pattern bullish or bearish?
It is bullish. The pattern marks the end of a downtrend and the start of a potential reversal higher. Its bearish mirror image is the triple top, where price fails three times to break through resistance.
How do you trade the triple bottom pattern?
Enter long when a candle closes above the highest peak between the valleys, or wait for the throwback retest of that level for a tighter entry. Place the stop below the nearer peak rather than below the whole pattern, so the risk reward stays workable. Target the pattern height multiplied by 74%, added to the breakout price.
What confirms the triple bottom pattern?
A close above the highest peak inside the pattern is the only true confirmation. Supporting evidence includes a volume spike on the breakout, fading volume across the three bottoms, and momentum indicators such as RSI turning up from oversold levels.
Where should the stop loss go for the triple bottom pattern?
Two options work. The strict version places it just below the lowest of the three valleys, which only triggers if the pattern is truly dead. The practical version places it just below the nearer of the two peaks, which now acts as support after the breakout, and keeps the risk reward above 1:2 on tall patterns.
Anupam has over 3 years of experience in the crypto industry, having worked with top indian crypto exchanges. He writes about Bitcoin, altcoins, AI, and emerging tech, helping readers understand what’s driving markets and where the digital asset ecosystem is headed.