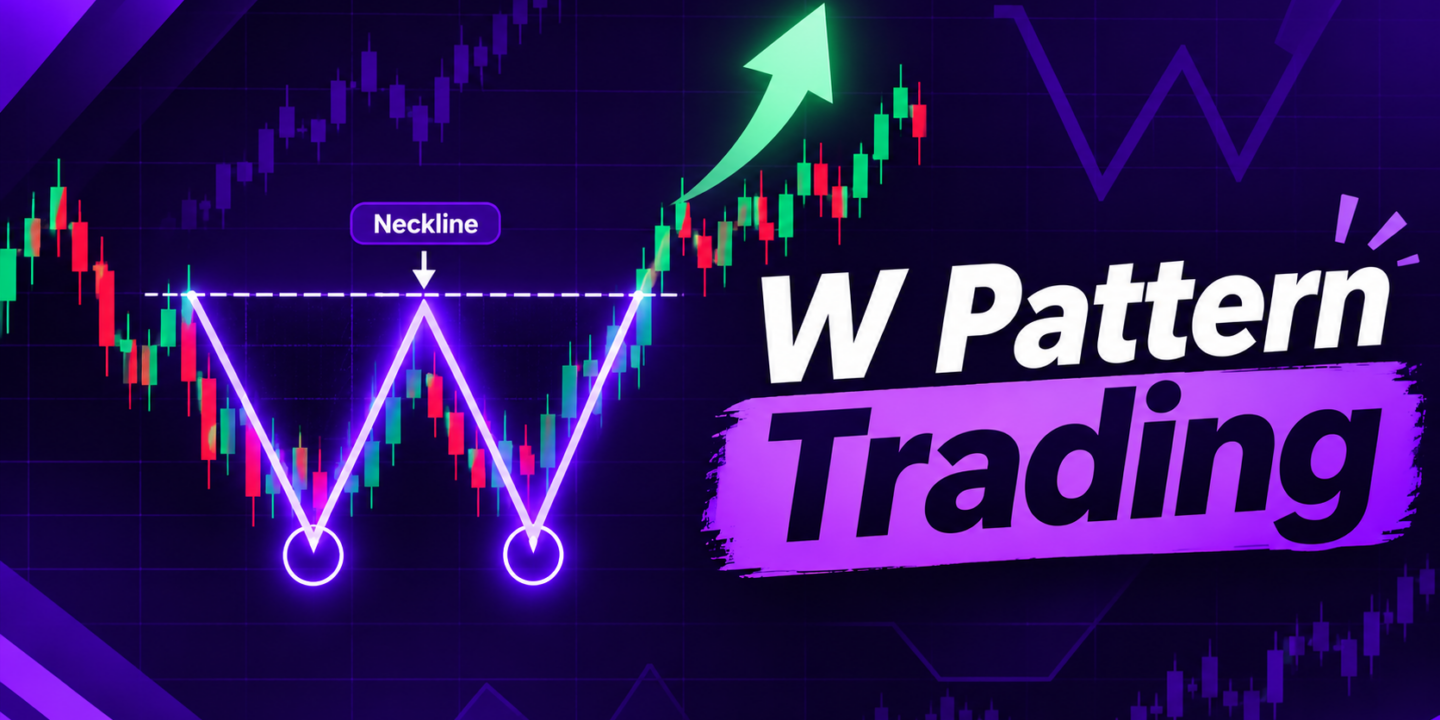
W pattern trading is built around one of the most tested formations in technical analysis, the double bottom. Price falls, bounces, drops back to roughly the same level, then pushes above the peak in between. On a chart it draws the letter W.
The structure is worth learning because it has been measured rather than assumed. In Thomas Bulkowski’s study of stock chart patterns, the classic version with two wide rounded bottoms ranks 5th out of 39 patterns for performance after an upward breakout, with a 12% break even failure rate and an average rise of 50%, based on 952 trades.
W pattern trading comes down to four decisions: what counts as a valid structure, what confirms it, where entry, stop loss and target go, and how much of the published edge survives in crypto. Here is each one.
What Is the W Pattern in Trading?
The W pattern is a bullish reversal formation made of two consecutive lows at a similar price, separated by a rally in between. Chartists call it a double bottom. The peak between the two lows is the neckline, and it is the only level that matters for confirmation.
W pattern trading rests on a single idea. Sellers drove the price to a low, failed to hold it on the second attempt, and buyers then took price above the level that capped the first bounce. Supply at that low has been absorbed.
One rule separates traders from spectators here. Until price closes above the middle peak, you do not have a double bottom. You have two dips. Bulkowski’s data puts a 48% chance on price continuing lower if you buy before that close.
Anatomy of the W Pattern Trading Setup
Five parts, each with a rule attached.
Part
What it should look like
Prior trend
Falling into the pattern. Without a decline there is nothing to reverse
First bottom
The low that ends the downtrend, usually on heavy volume
Middle peak
The bounce between the lows. The rise should measure at least 10% of the pattern
Second bottom
Near the same price as the first. The gap between them is small, typically 0% to 6%
Breakout
A close above the middle peak. This is the confirmation, and the entry trigger
Separation also matters. Across the four variants Bulkowski measured, the two lows usually sit two to seven weeks apart on a daily chart, with medians in the range of 16 to 23 days. Two lows three candles apart on a 5 minute chart are noise, not structure.
What the W Pattern Is Actually Telling You
Walk the sequence and the signal stops feeling like chart astrology.
Price falls hard. Sellers are in control and the trend is down.
A low prints and buyers step in. Price bounces to a level where selling resumes. That is the neckline.
Price rolls over and returns to the earlier low. This is the test that decides everything.
The low holds. Sellers could not push price into fresh lows.
Price closes above the neckline. The level that stopped the first rally has now been cleared.
That last step is the whole trade. A market that has been falling for weeks just failed to make a new low and then broke its own ceiling. The character of the move has changed.
How to Identify the W Pattern Trading Setup
Run every candidate through five checks. Fail one and it is a different structure.
A clear downtrend leads into the first bottom.
Both lows sit near the same price. A gap of a few percent is fine, 10% is not.
The rally between the lows is meaningful, ideally 10% or more of the pattern height.
The two lows are separated by real time, not two or three candles.
Price closes above the middle peak. No close, no pattern.
On timeframes, W pattern trading is far cleaner on daily and 4 hour charts than on 5 minute charts. Crypto trades 24×7, and thin liquidity hours throw up W shapes constantly that mean nothing. If you are learning, start on the daily.
Is the W Pattern Bullish or Bearish?
The W pattern is bullish. Its mirror image, the M pattern or double top, is bearish. Same logic, flipped.
W pattern (double bottom)
M pattern (double top)
Appears after
A downtrend
An uptrend
Shape
Two lows at a similar price
Two highs at a similar price
Neckline
The peak between the lows
The trough between the highs
Confirmation
Close above the neckline
Close below the neckline
Bias
Bullish reversal
Bearish reversal
Trade direction
Long
Short
A W shape that forms after a rally, in the middle of an uptrend, is usually a continuation consolidation rather than a reversal. It can still break out upward, but the measured move tends to be smaller because there is less decline to reverse.
The Four Types of W Pattern and How They Perform
Bulkowski splits the double bottom by the shape of each low. Narrow, spiky lows are called Adam. Wide, rounded lows are called Eve. The combination changes the odds, which is why W pattern trading is really four setups wearing the same letter.
Variant
Shape
Failure rate
Average rise
Target hit
Rank
Eve and Eve
Both lows wide and rounded
12%
50%
65%
5 of 39
Adam and Eve
Narrow low, then wide low
12%
43%
69%
17 of 39
Eve and Adam
Wide low, then narrow low
12%
42%
72%
20 of 39
Adam and Adam
Both lows narrow and spiky
16%
39%
73%
26 of 39
Source: Thomas Bulkowski, bull market results published at thepatternsite.com, based on 952, 1,020, 759 and 1,154 trades respectively.
Read the table carefully, because it contains a trap. Adam and Adam hits its measured target most often at 73%, yet it has the worst failure rate and the smallest average rise. The targets are simply smaller. Eve and Eve reaches its target least often at 65%, but when it runs, it runs furthest.
How to Trade the W Pattern Trading Setup
Work through a round numbered W pattern trading example. First bottom at $90,000, middle peak at $100,000, second bottom at $90,800. Pattern height is $10,000.
Entry
Two routes, and the second is usually the better trade.
Breakout entry: buy the close above $100,000. You are in early, and your stop has to sit below the second bottom, which is nearly $10,000 away.
Throwback entry: wait for price to retest the broken neckline. A throwback happens in 65% to 67% of double bottoms, so this is the common case rather than the rare one. Entry near $100,000 with the stop under the retest low at $96,500.
The throwback route is not about getting a prettier fill. It is about where the stop can sit. Same target, a quarter of the risk.
Stop loss
On a breakout entry, the stop goes just below the lower of the two bottoms. On a throwback entry, it goes just below the low of the retest. If price closes back under the neckline and keeps going, the breakout has busted and the reason for the trade is gone.
Size the position from the stop distance, never the other way round. A wide stop means a smaller position, not a bigger loss.
Target
Add the pattern height to the breakout level. Here, $10,000 added to $100,000 gives $110,000. Bulkowski’s data says the classic Eve and Eve version reaches that full projection 65% of the time, so booking part of the position there and trailing the rest is reasonable. The next structural resistance above is the second reference point.
Level
Price
Working
Breakout
$100,000
Close above the peak between the two lows
Pattern height
$10,000
$100,000 minus the $90,000 low
Entry
$100,000
On the throwback to the broken neckline
Stop loss
$96,500
Below the low of the retest
Risk
$3,500
$100,000 minus $96,500
Target
$110,000
Breakout plus pattern height
Reward
$10,000
$110,000 minus $100,000
Risk to reward
About 1:2.9
$3,500 risked against $10,000
If the numbers will not reach 1:2, skip it. A 12% failure rate paired with a 1:1 payoff is a slow way to give money back.
What Confirms a W Pattern Trading Setup
The shape is an alert. Four things turn it into a setup.
The breakout close. Price must close above the middle peak, not just wick through it.
Volume. Bulkowski found volume is usually higher on the first bottom than the second, and a breakout on expanding volume is the version you want.
Support. A second bottom that lands on a level price has respected before is worth several that print in open space.
Momentum. Rising RSI or a positive divergence between the two lows backs the story the structure is telling.
How Reliable Is W Pattern Trading?
This is where most guides go quiet. The figures above come from a study of US stocks in bull markets since 1991, not from crypto. Crypto is more volatile, trades 24×7 and has thinner books on smaller pairs, so expect more false breakouts and wider swings around the neckline than the stock data implies.
Treat the numbers as a ranking of structures rather than a prediction of outcomes. The useful takeaways hold across markets:
Confirmation is not optional. Without it, roughly half of these setups keep falling.
Tall patterns with a deep decline into them tend to produce the larger moves.
Most patterns retest the breakout level, so a missed entry is usually not a missed trade.
The edge sits in the risk to reward you build around the structure, not in the structure itself.
Mistakes That Ruin a W Pattern Trade
Most W pattern trading losses trace back to one of these six.
Entering before the breakout close. The most expensive error, and the most common.
No prior downtrend. Without the decline, there is nothing to reverse.
Lows too far apart in price. A 10% gap between the two bottoms is not a double bottom.
Reading W shapes on a 1 minute chart. The pattern needs time to form.
Moving the stop. Once price closes back below the neckline, the setup is dead.
Ignoring what sits overhead. A measured target that lands inside a heavy resistance zone is unlikely to be reached.
The Short Version
W pattern trading marks the moment a falling market tested its low twice, held, and then cleared the ceiling that capped the first bounce. The structure is one of the better ranked reversal patterns in the published data, but every figure behind it assumes you waited for the close above the neckline.
Find a W at a level that already mattered. Wait for the breakout close. Enter on the throwback, stop under the retest low, target the pattern height above the neckline, and only take it if the payoff clears 1:2.
Put it on a live chart
Pull up a daily BTC or ETH chart, mark the last three W patterns you can find, and check what happened after each breakout close. Then trade long or short with INR margin on Mudrex Futures.
The W pattern, also called a double bottom, is a bullish reversal formation of two lows at a similar price separated by a rally. It confirms only when price closes above the peak between the two lows, which signals that sellers failed to make a new low and buyers have cleared the level that capped the first bounce.
2. How do you identify the W pattern in trading?
Check five things: a downtrend leads into the first low, both lows sit near the same price, the rally between them is meaningful, the lows are separated by weeks rather than candles, and price closes above the middle peak. If the close above the peak is missing, it is not a double bottom yet.
3. Is the W pattern bullish or bearish?
Bullish. It forms after a decline and signals a potential reversal upward. The mirror image, the M pattern or double top, forms after a rally and is bearish. Position on the chart decides the meaning, not the shape alone.
4. How do you trade the W pattern?
W pattern trading entries come in two forms. Enter long on the close above the neckline, or wait for the throwback to that level, which happens in roughly two thirds of cases. Place the stop below the lower bottom on a breakout entry, or below the retest low on a throwback entry. Target the pattern height projected above the neckline, and take the trade only if the reward is at least twice the risk.
5. What confirms the W pattern?
A close above the middle peak is the primary confirmation. Supporting evidence includes expanding volume on the breakout, the second low forming at an established support level, and rising momentum or a positive RSI divergence between the two lows.
6. Where should the stop loss be placed for the W pattern?
Just below the lower of the two bottoms if you entered on the breakout close, or just below the retest low if you entered on the throwback. If price closes back under the neckline, the breakout has busted and the reason for the trade no longer exists.
Anupam has over 3 years of experience in the crypto industry, having worked with top indian crypto exchanges. He writes about Bitcoin, altcoins, AI, and emerging tech, helping readers understand what’s driving markets and where the digital asset ecosystem is headed.