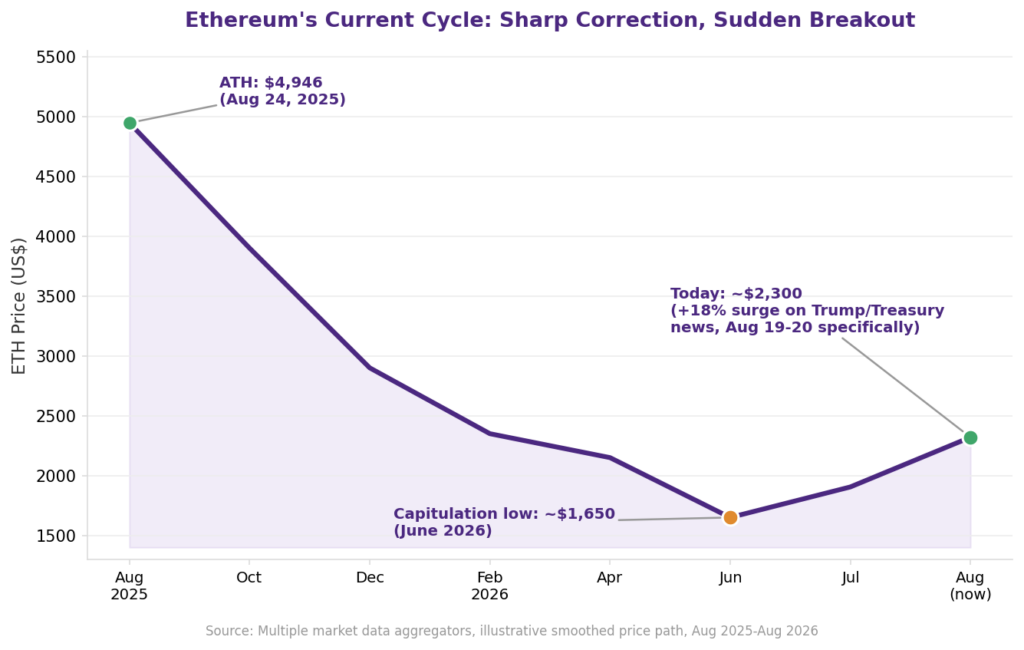
The current Ethereum market cycle just delivered its sharpest twist in weeks: ETH surged nearly 18% on August 19-20 to trade around $2,300, still roughly 53% below the $4,946 all-time high it hit in August 2025.
That move came from two catalysts hitting at once, the US Treasury’s surprise decision to double bond buybacks, and a White House crypto summit where President Trump hosted the CEOs of Coinbase, Kraken, and Robinhood to push Congress toward passing the CLARITY Act. The rally pushed ETH back above its realized price, a genuinely bullish on-chain signal, right as several longer-term indicators, MVRV against its historical support band, record staking participation, were already flashing signs typically associated with cycle bottoms.
The next major test comes September 15, when the Senate holds a cloture vote on the CLARITY Act itself. Here’s where the current Ethereum market cycle actually stands, indicator by indicator.
Key Takeaways
The current Ethereum market cycle shows a mix of undervaluation signals and unresolved weakness, making it one of the more genuinely ambiguous points in Ethereum’s market cycle history to date.
ETH trades around $2,300, roughly 53% below its August 2025 all-time high of $4,946, after jumping ~18% on August 19-20 following a Treasury bond-buyback announcement and a White House crypto summit pushing the CLARITY Act.
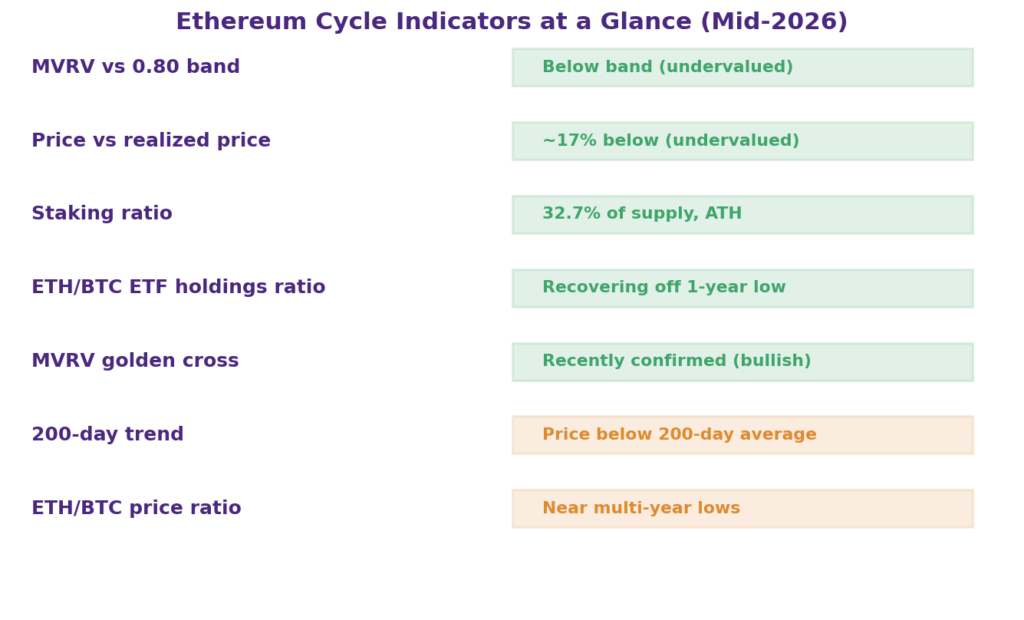
That rally pushed ETH back above its realized price, adding a fresh bullish signal to several longer-term indicators already pointing toward the later stages of markdown or early accumulation: MVRV below a key band that marked the last three cycle bottoms, and staking participation at an all-time high of 32.7% of supply.
The ETH/BTC ratio remains near multi-year lows, though ETF holdings data has shown its first meaningful uptick in a year.
A September 15 Senate cloture vote on the CLARITY Act is the next major regulatory catalyst; despite the White House push, Republicans still need roughly six Democratic crossovers, and failure could stall the bill for the rest of 2026.
A capitulation low near $1,650 in June 2026 now sits well below the current price, marking the sharpest point of ETH’s drawdown before this month’s recovery began.
What Stage of the Ethereum Market Cycle Are We In?
Ethereum currently sits in a late-markdown-to-early-accumulation zone, based on a combination of price structure and on-chain data, though no single indicator confirms a new phase has definitively begun.
Current Ethereum Market Cycle: Where Are We in 2026?
ETH trades ~53% below its August 2025 all-time high of $4,946, after an ~18% two-day rally on August 19-20.
Price just reclaimed its realized price following the rally, a level it had sat below by roughly 17% as recently as July, historically a bullish transition signal.
MVRV had dropped below the 0.80 band that marked each of the last three cycle bottoms, before this month’s bounce.
Staking participation just hit an all-time high of 32.7% of ETH’s total supply.
The ETH/BTC ratio remains weak, near multi-year lows, even as ETH-specific metrics improve.
Definition: Market Cycle Stage The phase a market currently occupies within a recurring pattern of expansion and contraction, typically categorized as accumulation, markup, distribution, or markdown, based on price structure and investor behavior.
How Is Ethereum’s Market Cycle Measured?
Ethereum’s market cycle is typically measured using a combination of on-chain valuation metrics, price-structure indicators, and capital-flow data, since no single number reliably captures cycle position on its own.
The most-watched categories include valuation ratios like MVRV and realized price, which compare current price to the network’s aggregate cost basis; sentiment gauges like NUPL, which track unrealized profit and loss across the holder base; and flow-based signals like ETF inflows and exchange reserves, which show whether capital is entering or leaving the ecosystem. Staking ratio and validator counts add a supply-side lens specific to Ethereum’s proof-of-stake design. Our guide to on-chain analysis in crypto covers how these tools are used in more depth.
Not directly. Ethereum has no halving mechanism, so its market cycle is shaped primarily by Bitcoin’s own cycle, broader macro liquidity, and Ethereum-specific catalysts like protocol upgrades and ETF approvals, rather than a fixed four-year schedule tied to a supply-issuance event.
Bitcoin’s cycle is anchored to a mechanical, predictable event: its issuance rate is cut in half roughly every four years. Ethereum’s issuance instead adjusts dynamically based on staking participation and network activity, with no equivalent scheduled shock. In practice, this means the Ethereum market cycle tends to closely track Bitcoin’s broader risk-on and risk-off swings, while adding its own volatility on top tied to events like the 2022 Merge to proof of stake, spot ETF approvals, and Layer 2 scaling upgrades. This is part of why the Ethereum market cycle has historically been described as a higher-beta, more volatile version of Bitcoin’s cycle rather than running an entirely independent one.
Is Ethereum Currently in Accumulation or Markdown?
The data points in both directions, which is itself informative about where the Ethereum market cycle currently sits: Ethereum shows classic late-markdown characteristics alongside a few early accumulation-style signals, consistent with a market that has stopped falling sharply but hasn’t yet confirmed a new uptrend.
Current Ethereum Market Cycle: Where Are We in 2026?
Definition: Accumulation Phase A market stage where informed or patient buyers steadily build positions while prices are flat or depressed and public sentiment remains poor, typically occurring after a markdown phase has largely run its course.
On the accumulation side: ETH trading below its realized price, a confirmed MVRV golden cross, and record staking participation all echo patterns seen near past cycle lows. On the markdown side: price remains below its 200-day moving average, and the ETH/BTC ratio hasn’t meaningfully turned yet, suggesting relative weakness against Bitcoin persists even where ETH’s own metrics look constructive.
What Do On-Chain Indicators Show About the Current ETH Cycle Stage?
On-chain indicators currently show the Ethereum market cycle trading below key valuation anchors, with several metrics at or near levels that have historically preceded recoveries, though not yet with the full confirmation that has marked past bottoms.
Ethereum fell below its 0.80 MVRV pricing band in February 2026, a threshold that aligned with each of the previous three cycle bottoms. By July 2026, ETH was trading roughly 17% below its realized price, meaning the average holder’s cost basis sits above the current market price, a condition that has historically preceded periods of accumulation rather than further distribution.
The ETH/BTC ratio matters to Ethereum market cycle analysis because it strips out Bitcoin’s own price movement, isolating whether capital specifically favors Ethereum or is rotating away from it, and right now that ratio remains one of the weaker pieces of the cycle picture.
ETH/BTC has traded near multi-year lows through much of 2026, reflecting a period where Bitcoin has captured a larger share of institutional and retail attention. There is one tentative positive signal underneath the headline weakness: the ETH/BTC ETF holdings ratio, which tracks the relative size of Ethereum versus Bitcoin ETF assets, fell from around 0.20 in August 2025 to roughly 0.115 by June 2026, then recovered to about 0.13 since late June, its first meaningful uptick in a year.
It’s a modest move off a low base, but a reversal in a ratio that had only gone one direction for months is exactly the kind of early signal cycle analysis looks for.
Have ETFs Changed Ethereum’s Cycle?
Yes, meaningfully, and it’s one of the more structural changes to the Ethereum market cycle compared to prior years. Spot Ethereum ETFs, launched in July 2024, have accumulated more than $11 billion in cumulative net inflows, adding a structural source of demand that didn’t exist in Ethereum’s prior cycles and giving institutional allocators a regulated way to gain exposure without self-custody.
Corporate treasury companies have amplified this further: entities now hold more than 6.2 million ETH collectively, up from under 1 million in mid-2025, with the largest single holder, BitMine, controlling roughly 3-4% of circulating supply and earning over $200 million annually from staking those holdings. Staking-enabled ETF products, including BlackRock’s ETHB launched in March 2026, have added a yield dimension that pure spot exposure didn’t offer before. None of this eliminates Ethereum’s cyclicality, ETF flows can and do turn negative, but it does mean a larger share of ETH is now held by structurally slower-moving hands than in past cycles.
How Are Macro Events Shaping Ethereum’s Cycle Right Now?
One macro catalyst has already hit, and a second, arguably bigger one is still ahead, both worth understanding in detail since they’re actively reshaping the backdrop the Ethereum market cycle trades against.
Current Ethereum Market Cycle: Where Are We in 2026?
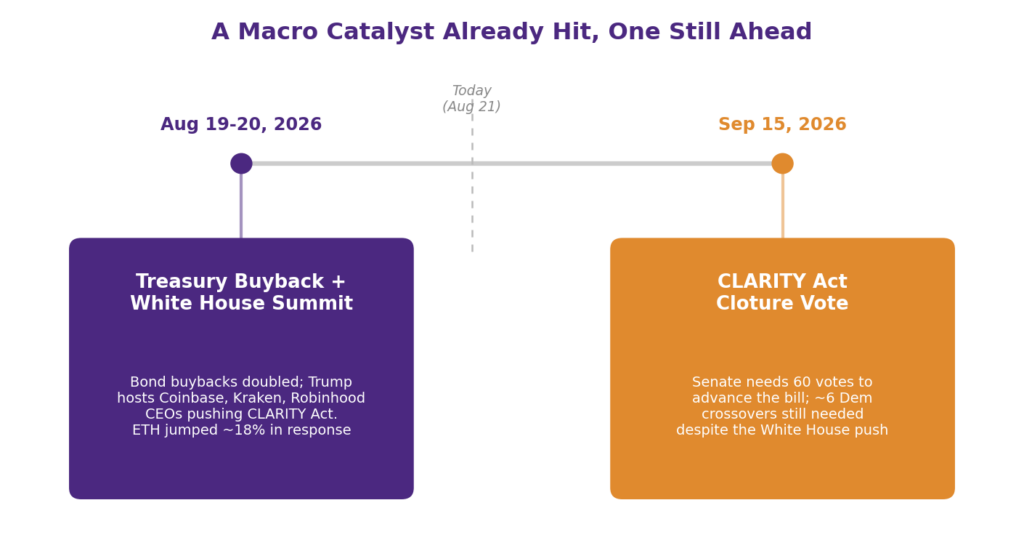
On August 19, 2026, the US Treasury unexpectedly announced it would at least double the size of its long-dated bond buyback operations, from $2 billion to at least $4 billion per operation, after the 30-year Treasury yield hit a 19-year high near 5.27%.
On the same day, President Trump hosted a White House crypto summit, joined by Coinbase CEO Brian Armstrong, Gemini’s Tyler and Cameron Winklevoss, Kraken co-CEO Arjun Sethi, and Robinhood CEO Vlad Tenev, where he publicly pressed Congress to pass the CLARITY Act. The combination triggered a sharp, synchronized rally: Bitcoin jumped over 11% to briefly top $71,000-72,000, its highest level since early June, while Ethereum surged nearly 18% toward $2,300, triggering an estimated $1.1 billion in ETH short liquidations along the way.
For risk assets like Ethereum, the Treasury’s move functions primarily as a liquidity signal, easing stress in government bond markets, rather than direct monetary easing from the Federal Reserve, so its crypto read-through is indirect even though the market reaction was immediate and sizable. The White House event carries more direct relevance: presidential pressure on Congress doesn’t guarantee legislative outcomes, but it does signal where political priority sits heading into the next vote.
That next vote is the bigger unresolved catalyst. The Senate is scheduled to hold a cloture vote on the CLARITY Act on September 15, 2026, after recessing in August without action. The vote needs 60 votes to proceed, and Republicans still need roughly six Democratic crossovers, a gap that hasn’t closed since the bill cleared the Senate Banking Committee in May on a 15-9 vote, and one that this week’s White House push, however high-profile, hasn’t mechanically resolved. Sticking points include ethics and conflict-of-interest provisions, stablecoin yield rules, and enforcement authority.
A successful cloture vote would keep the bill, and the regulatory clarity it promises for exchanges and digital asset classification, on track; a failed vote could effectively shelve US crypto market structure legislation until after the 2026 midterms. Our recent look at Ethereum’s regulatory and macro risk landscape covers the CLARITY Act’s stakes for ETH specifically in more detail.
When Could the Next Ethereum Cycle Phase Begin?
There’s no reliable way to call an exact date, but a cluster of signals, rather than any single one, would mark more convincing confirmation that the Ethereum market cycle has moved into a new phase.
Watch for the ETH/BTC ratio sustaining a genuine uptrend rather than a brief bounce, ETF flows staying net positive for several consecutive months, price reclaiming and holding above the 200-day moving average, and continued staking growth alongside rising on-chain activity rather than staking growth alone. The two macro catalysts above are also worth tracking directly: a resolved CLARITY Act vote in either direction, and whether Treasury market stress continues to require intervention, will likely influence risk appetite across crypto well beyond Ethereum specifically.
Conclusion
The current Ethereum market cycle just got more interesting, not less ambiguous. Several on-chain indicators, MVRV, realized price, and staking participation, resemble patterns seen near past cycle bottoms, and an ~18% rally on August 19-20 pushed ETH back above its realized price on the back of a Treasury liquidity move and a high-profile White House push for the CLARITY Act.
But price structure below the 200-day average and a still-weak ETH/BTC ratio mean the longer-term trend hasn’t fully turned, and the September 15 cloture vote remains genuinely uncertain despite this week’s momentum. Rather than trying to call the exact bottom off one strong week, tracking whether these signals continue confirming each other into September is the more useful exercise for understanding where Ethereum’s cycle goes from here.
Most indicators point to a late-markdown-to-early-accumulation zone in the current Ethereum market cycle: ETH just reclaimed its realized price after an August rally, with record staking participation, though the ETH/BTC ratio and longer-term trend haven’t fully confirmed a new phase.
How is Ethereum’s market cycle measured?
The Ethereum market cycle is measured through a combination of on-chain valuation metrics like MVRV and realized price, sentiment gauges like NUPL, and flow data like ETF inflows and staking ratio, since no single metric is reliable alone.
Does ETH follow Bitcoin’s four-year cycle?
Not directly. Ethereum has no halving mechanism, so the Ethereum market cycle tracks Bitcoin’s broader risk swings and macro liquidity, with added volatility from ETH-specific catalysts like upgrades and ETF flows.
Is Ethereum currently in accumulation or markdown?
Signals are mixed within the current Ethereum market cycle: undervaluation metrics and staking data suggest accumulation-like conditions, while price trend and the ETH/BTC ratio still reflect markdown-phase weakness.
Which on-chain indicators show the cycle stage?
MVRV, realized price, NUPL, staking ratio, exchange reserves, and ETF flow data are the most commonly used indicators for gauging the Ethereum market cycle’s current position.
How does the ETH/BTC ratio affect cycle analysis?
It isolates whether capital favors Ethereum specifically versus Bitcoin within the broader Ethereum market cycle; a weak or falling ratio suggests capital rotation away from ETH even if ETH’s own price metrics look constructive.
Have ETFs changed Ethereum’s cycle?
Yes. Over $11 billion in cumulative ETF inflows and over 6.2 million ETH held by corporate treasuries have added a more structural, slower-moving demand base to the Ethereum market cycle than prior cycles had.
When could the next cycle phase begin?
There’s no reliable exact timing, but sustained ETH/BTC strength, consistently positive ETF flows, and a reclaimed 200-day moving average would be meaningful signals that the Ethereum market cycle has turned a corner.
Risk Disclaimer
Cryptocurrency investments carry a high risk of loss and are highly volatile. Any use of leverage or futures magnifies both potential gains and potential losses. The on-chain indicators, macro analysis, and figures in this article are illustrative and for educational purposes only; they are not financial advice or a guarantee of future performance. Please consult a qualified financial advisor before making any investment decisions.
Siri is a writer venturing into the exciting realms of blockchain technology, cryptocurrency, and decentralized finance (DeFi), eager to explore the transformative potential of these innovations. She brings a unique perspective that bridges traditional industries and cutting-edge technology, often infused with a touch of humor through memes. She has a rich background in real estate and interior design, having previously contributed to NoBroker, where she crafted blogs and assets on these topics.