
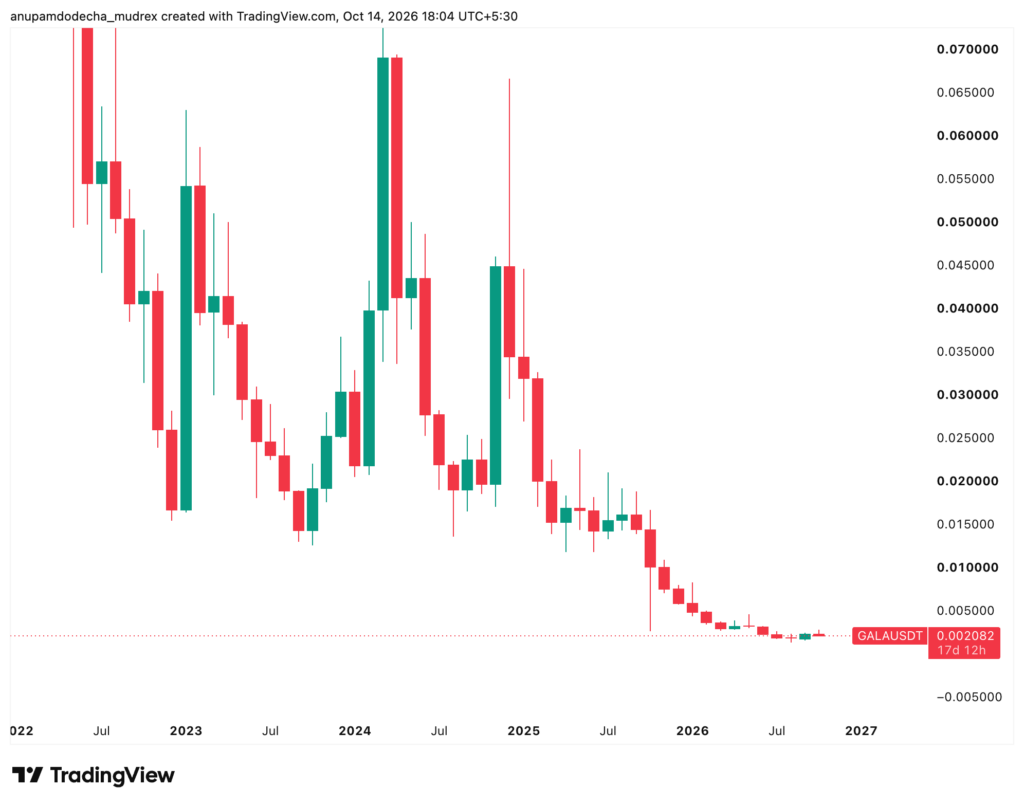
GALA is trading at $0.002284, or about ₹0.22, and sits 99.73% below the all-time high it reached in November 2021. Its supply model also changed in April 2026, when GalaChain node operators voted to replace the 50 billion token cap with a new emission schedule. Both factors shape any GALA price prediction for the years ahead.
In summary, the base case in this GALA price prediction puts GALA near $0.0080 by 2030, which is about ₹0.76. The bullish case is $0.0195, or roughly ₹1.86, and the bearish case is $0.0022. A $1 price is not a realistic outcome within this period, for reasons set out later in the article.

All figures below are sourced and dated. These are scenarios based on stated assumptions rather than forecasts of fact, and none of this is investment advice.
| Metric | Value (14 Oct 2026) |
|---|---|
| GALA price | $0.002284 (₹0.2184) |
| Market cap | $115.41M (rank #188) |
| 24h volume | $30.13M |
| Circulating supply | 50.53B GALA |
| Total supply | 50.53B GALA |
| Holders | 219,110 |
| All-time high | $0.8367 (26 Nov 2021) |
| All-time low | $0.000151 (28 Dec 2020) |
Four factors have the largest influence on the GALA price.
1. Token supply, now the dominant factor. In April 2026, GalaChain’s Founder’s Node operators voted to replace the 50 billion hard cap with a disinflationary emission schedule: 15% in year one, decaying 15% annually toward a 1.5% floor. Half of all GalaChain gas fees now go to node operators and half are burned permanently. Total supply has already passed 50.52 billion, above the old cap.
2. GalaChain activity. Burns are funded entirely by gas fees, so the burn rate is a direct function of how much the chain is used. GalaChain runs Proof of Authority with block times under two seconds and supports Gala Games, Gala Music and Gala Film, plus external developers building through the GalaChain SDK. If activity scales, burns can offset emissions. If it stalls, the 15% dilutes holders.
3. The node economy. There are 50,000 Founder’s Nodes, and the April vote raised their Day 1 rewards roughly 3.2x. More rewards means more tokens reaching operators who may sell, which is a near term headwind even though it strengthens network security.
4. Broad market conditions. GALA is a gaming and NFT token, a category that moves harder than the market in both directions. With Bitcoin at $82,218 and sentiment in fear territory, GALA is trading on beta, not on fundamentals.
GALA attempted to break its longer term downtrend in early October 2026, but the move has not held so far.
On 2 October, GALA closed above its 200-day moving average for the first time in 375 consecutive sessions, a run of closes at or below that line stretching back to 22 September 2025. The 14-day RSI hit 70.50 the same day, its first reading above 70 since May 2026. Price has since slipped back under the 200-day, which sat at $0.00253.
| Level | Price | Role |
|---|---|---|
| Resistance 3 | $0.00260 | Upside target on a breakout |
| Resistance 2 | $0.00253 | 200-day moving average, the line that matters |
| Resistance 1 | $0.00236 | First ceiling |
| Current price | $0.002284 | |
| Support 1 | $0.00220 | First floor |
| Support 2 | $0.00212 | Stronger floor |
| Support 3 | $0.00187 | 50-day moving average |
A daily close back above $0.00253 on strong volume would confirm the October attempt. A close below $0.00212 would open the way toward the 50-day average at $0.00187. Until either happens, GALA remains range bound between roughly $0.00212 and $0.00236.
Under the April 2026 emission model, the number of GALA tokens in circulation grows each year. A flat price therefore requires a rising market cap, so supply needs to be modelled alongside demand.
| Year end | Emission rate | Projected supply, gross | Projected supply, after burns |
|---|---|---|---|
| 2026 | 15% | 52.1B | 51.9B |
| 2027 | 14.3% | 59.6B | 58.4B |
| 2028 | 12.1% | 66.8B | 64.7B |
| 2029 | 10.3% | 73.7B | 70.6B |
| 2030 | 8.8% | 80.2B | 76.3B |
Assumptions: the schedule starts at 15% and decays 15% a year, as voted. Calendar-year rates are blended because the schedule runs on a April anniversary. The final column assumes burns offset roughly 15% of emissions, which requires GalaChain fee activity to grow steadily. If activity stalls, use the gross column.
A useful benchmark: to hold today’s price of $0.002284 at the end of 2030 with 76.3B tokens outstanding, GALA’s market cap would need to rise from $115M to about $174M, an increase of 51%. Any GALA price forecast still based on the older 50 billion supply figure will understate this effect.
Each 2030 target below is a projected market cap divided by the roughly 76.3B GALA expected to be in circulation by that point.
| Scenario | 2030 target | vs today | Implied market cap | What it needs |
|---|---|---|---|---|
| Bearish | $0.0022 | -4% | ~$168M | GalaChain activity flat, burns fail to offset emissions |
| Base | $0.0080 | +250% | ~$610M | Steady ecosystem growth, one normal bull cycle |
| Bullish | $0.0195 | +754% | ~$1.49B | A breakout game or app, burns exceeding emissions |
The bearish case sits close to today’s price, which reflects the dilution effect. GALA could trade near current levels in 2030 while the circulating supply has grown by roughly half over the same period.
Converted at ₹95.6 to $1, the rate implied by CoinMarketCap’s GALA/INR quote on 14 October 2026.
| Scenario | 2030 target (USD) | 2030 target (INR) | ₹10,000 invested today becomes |
|---|---|---|---|
| Bearish | $0.0022 | ₹0.21 | ~₹9,600 |
| Base | $0.0080 | ₹0.76 | ~₹35,000 |
| Bullish | $0.0195 | ₹1.86 | ~₹85,400 |
A note on currency risk. These INR figures hold the rupee constant. The rupee has weakened against the dollar over recent years, and if that continues your INR return would be higher than the table shows even with the same USD outcome. A stronger rupee would reduce it. Any GALA coin price prediction in INR therefore depends on both the token and the exchange rate.
| Year | Bearish | Base | Bullish | Base market cap |
|---|---|---|---|---|
| 2026 | $0.0015 | $0.0024 | $0.0038 | ~$125M |
| 2027 | $0.0012 | $0.0031 | $0.0062 | ~$181M |
| 2028 | $0.0016 | $0.0048 | $0.0105 | ~$311M |
| 2029 | $0.0019 | $0.0062 | $0.0145 | ~$438M |
| 2030 | $0.0022 | $0.0080 | $0.0195 | ~$610M |
| Year | Bearish | Base | Bullish |
|---|---|---|---|
| 2026 | ₹0.14 | ₹0.23 | ₹0.36 |
| 2027 | ₹0.11 | ₹0.30 | ₹0.59 |
| 2028 | ₹0.15 | ₹0.46 | ₹1.00 |
| 2029 | ₹0.18 | ₹0.59 | ₹1.39 |
| 2030 | ₹0.21 | ₹0.76 | ₹1.86 |
2027 carries the lowest bear case because it is the year supply grows fastest in absolute terms while emission decay has barely started. 2028 steps up because the Bitcoin halving lands that April, and gaming tokens have historically caught that cycle with a lag.
Bull case: burns beat emissions. GalaChain fee volume grows fast enough that the 50% burn share outpaces the declining emission rate, flipping GALA from inflationary to deflationary. This realistically needs a breakout title or a large external developer bringing real transaction volume. Pair it with a broad altcoin cycle and $0.0195 by 2030 is reachable.
Base case: steady but diluted. GalaChain grows at a normal pace, burns offset part of emissions, and GALA participates in one bull cycle without leading it. Market cap roughly five times from here to $610M, but supply grows 51%, so the price only rises 250%. This is the most likely path.
Bear case: activity stalls. Fee revenue stays thin, burns stay negligible, and the full 15% emission schedule dilutes holders. Node operators keep selling rewards. GALA grinds sideways in nominal terms while losing real value, landing near $0.0022 in 2030.
The gap between the bullish and bearish cases is close to 9x, which reflects how much of the outcome depends on a single variable: GalaChain transaction activity.
A $1 GALA price is not a realistic outcome this decade. The reason comes down to supply arithmetic.
At today’s 50.53B circulating supply, a $1 GALA price means a $50.5B market cap. By 2030, with roughly 76.3B tokens projected to exist, $1 means a $76.3B market cap. That is about 661 times GALA’s current $115.41M.
Because supply grows each year under the new emission model, the market cap required for a $1 price rises over time rather than falling. GALA’s all-time high of $0.8367 in November 2021 was also set when a fraction of today’s supply existed.
A more useful question is what market cap GALA could plausibly reach. The bull case of $1.49B by 2030 would already be a 13x from here, and would put GALA back near the valuations of established mid cap tokens.
If GALA fits your risk appetite, here is how Mudrex supports buying and trading it in India.
The conclusion of this GALA price prediction is that GALA’s outlook depends mainly on GalaChain usage, because that determines whether burns can offset the new emission schedule.
The base case puts GALA at $0.0024 by the end of 2026 and $0.0080 by 2030, which is ₹0.23 and ₹0.76. The bull case of $0.0195 needs burns to overtake emissions. The bear case of $0.0022 is what happens if the chain stays quiet, and in a diluting token that outcome is worse than the flat price makes it look.
Two numbers are worth tracking: GalaChain fee volume, which drives the burn rate, and total supply, which shows whether burns are offsetting emissions. If supply growth slows below the voted emission rate, the bullish case becomes more plausible. If it continues tracking 15%, the base or bearish cases are more likely.
This article is for information only and is not investment, tax or legal advice. Crypto assets are volatile and you can lose your capital. Figures are as of 14 October 2026 and will change.
What is the GALA price prediction for 2030?
The base case GALA price prediction for 2030 is $0.0080, or about ₹0.76, implying a $610M market cap. The bullish case is $0.0195 (₹1.86) and the bearish case is $0.0022 (₹0.21). All three divide a projected market cap by the roughly 76.3B GALA expected to exist by 2030.
What is the GALA price prediction for 2026?
The base case GALA price prediction for the end of 2026 is $0.0024, roughly 5% above the 14 October 2026 price of $0.002284. The bearish case is $0.0015 if GALA loses the $0.00212 support. The bullish case is $0.0038, which needs a daily close back above the 200-day moving average at $0.00253.
Will GALA coin go up?
GALA can rise, but it needs to outpace its own supply growth. Under the emission model approved in April 2026, GALA supply grows about 15% a year with the rate decaying annually. GALA’s market cap must rise roughly 51% by 2030 just to hold today’s price. Going up means burns from GalaChain fees overtaking that emission rate.
Can GALA reach $1?
Not this decade. A $1 price at today’s 50.53B supply means a $50.5B market cap, and by 2030 with about 76.3B tokens it means $76.3B, around 661 times GALA’s current $115.41M. Because supply keeps growing, the $1 target moves further away each year rather than closer.
Is GALA a good investment?
That depends on your risk tolerance and is a decision only you can make. GALA has genuine liquidity, with daily volume at 26% of market cap, a working layer-1 chain and a named development team. It also has 15% annual token emissions, unproven fee revenue and a 99.73% drawdown. Treat it as speculative.
What affects the GALA price?
Four things: GalaChain fee volume, which funds the burn mechanism; the emission schedule, now starting at 15% a year and decaying 15% annually; selling pressure from 50,000 Founder’s Node operators whose rewards rose about 3.2x in April 2026; and the broader gaming and NFT token sector, which moves harder than the market in both directions.