A DeXe liquidation map turns thousands of leveraged DEXE futures positions into a single color-coded picture, and reading it correctly is especially important for a token this thin. DEXE currently trades with roughly $39 million in open interest against a $215 million market cap, an unusually high ratio, while futures volume regularly runs 5-6 times spot volume. Add in extreme holder concentration: a single wallet holds roughly half of DEXE’s entire supply, and you get a token where liquidation cascades hit harder and faster than they would on Bitcoin or Ethereum.
Here’s exactly how a DEXE liquidation heatmap is built, how to read it, and why this particular altcoin deserves extra caution.
Key Takeaways
A DeXe liquidation map is a modeled estimate, not confirmed exchange data, built from open interest, assumed leverage distributions, and standard maintenance margin formulas.
DEXE’s open interest sits at roughly 18% of its market cap, an elevated ratio that signals heavy leverage relative to the token’s actual size.
Futures volume on DEXE regularly runs 5-6 times spot volume, meaning most trading activity is leveraged speculation rather than actual token exchange.
DEXE’s supply is extremely concentrated: one wallet holds roughly half the total supply, and the top five wallets combined control nearly 96%.
Liquidation heatmaps are explicitly less reliable for thin altcoins like DEXE, according to the data providers that build them, since low open interest and whale concentration distort the underlying model.
What Is a DeXe Liquidation Map?
A DeXe liquidation map is a visual, color-coded chart that estimates where clusters of leveraged DEXE futures positions would be forcibly closed if price reached those levels.
Shows estimated long and short liquidation clusters at different price levels.
Uses color intensity to represent how concentrated the modeled liquidations are at each price point.
Is built from open interest and modeled leverage data, not a direct feed of real trader positions.
Works the same way for DEXE as it does for Bitcoin or Ethereum, but the underlying data is thinner and less reliable.
Definition: Liquidation The forced closure of a leveraged trading position by an exchange, triggered when a trader’s margin can no longer cover potential losses at the current mark price.
How Is a DEXE Liquidation Heatmap Calculated?
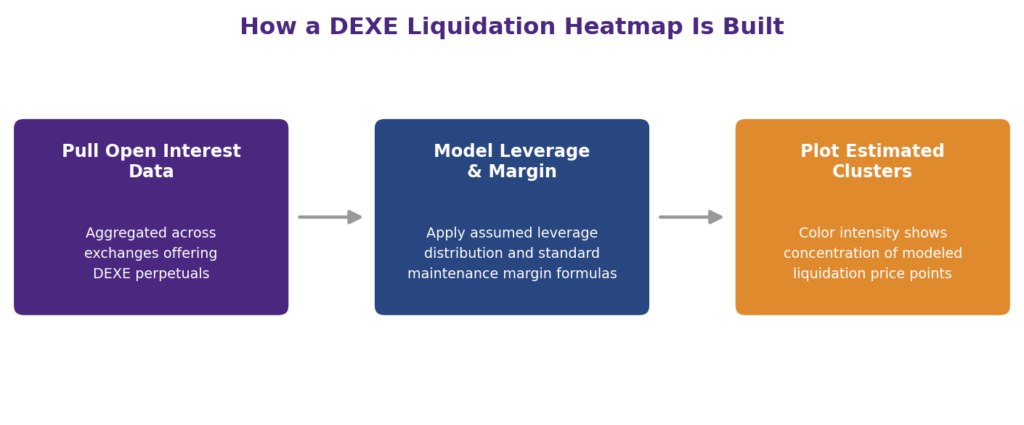
A DEXE liquidation map is calculated by combining open interest data with an assumed distribution of leverage levels, then applying standard maintenance margin formulas to estimate where clusters of positions would face forced closure.
How is a DEXE liquidation heatmap calculated
ALT TEXT: How is a DEXE liquidation heatmap calculated: three-step process diagram showing pulling open interest data across exchanges offering DEXE futures, modeling leverage and margin using assumed distributions, and plotting estimated liquidation clusters by color intensity
Definition: Open Interest The total dollar value of outstanding futures or perpetual contracts that haven’t yet been closed or settled, used as the base input for estimating how many leveraged positions exist at any given time.
Since exchanges don’t publish each individual trader’s exact liquidation price, heatmap providers like CoinGlass model this instead: they take aggregated open interest, apply commonly observed leverage ratios, and calculate where a maintenance-margin-based liquidation would occur for positions of that size. The result is aggregated across multiple exchanges and displayed as a thermal, color-graded overlay on the price chart, updated in real time as new positions open and close.
How Do You Read a DeXe Liquidation Map?
You read a DeXe liquidation map by looking at the price axis for where colored bands sit relative to the current price, and the color intensity of each band for how large the estimated cluster of positions is at that level.
Bands below the current price typically represent long positions that would be liquidated if DEXE falls to that level; bands above represent short positions that would be liquidated if DEXE rises to that level. Most tools let you select different timeframes (24-hour, 7-day, 30-day) to distinguish short-term leverage buildup from longer-standing liquidation walls. Our broader guide to liquidation maps in crypto futures trading covers the general reading technique in more depth, using Bitcoin as the primary example.
What Do Bright Colours Indicate?
Bright or “hot” colors on a DEXE liquidation map indicate a denser concentration of estimated leveraged positions clustered at that specific price level, meaning a larger potential cascade of forced buying or selling if price reaches it.
Cooler, dimmer colors indicate a thinner, more scattered set of positions, where a price move through that zone is less likely to trigger a rapid cascade of forced liquidations. The brightest zones function as informal “magnets”: once price starts moving toward one, the increasing likelihood of triggering forced order flow can itself accelerate the move, since each liquidation in a long cluster adds forced selling, and each liquidation in a short cluster adds forced buying, in the same direction the price was already heading.
Why Does DEXE Move Toward Liquidation Clusters?
DEXE tends to move toward large liquidation clusters because triggering them creates one-directional forced order flow that can accelerate an already-moving price, sometimes referred to informally as a magnet effect.
When a bright cluster of long liquidations sits below the current price and price drifts down toward it, each position that gets liquidated adds a market sell order, pushing price further down and triggering the next cluster of stops in sequence. This is exactly how a long squeeze or short squeeze cascades: it’s not that the market is deliberately hunting stops in some coordinated sense, though large traders can and do exploit this dynamic; it’s that the mechanical process of forced closures naturally reinforces the direction price was already moving once it breaks into a dense zone.
Are DEXE Liquidation Levels Accurate?
Not precisely, and less so than for Bitcoin or Ethereum. DEXE liquidation levels are modeled estimates built on assumptions about leverage distribution, and those assumptions hold up better for high-volume, deeply liquid assets than for a thinner altcoin like DEXE.
Data providers themselves acknowledge this limitation: liquidation heatmap accuracy is strongest for high-volume pairs and weakens considerably for lower-volume altcoins where open interest is too thin to produce statistically meaningful clusters. DEXE’s roughly $39 million in open interest is a fraction of what Bitcoin or Ethereum carry, meaning the same modeling approach has far less data to work with, and the resulting clusters should be treated as rough zones of elevated risk rather than precise, guaranteed levels.
Why Do Low-Liquidity Tokens Like DEXE Experience Liquidation Cascades?
Low-liquidity tokens like DEXE experience sharper liquidation cascades because a smaller pool of real buyers and sellers means the same dollar amount of forced selling or buying moves the price much further than it would on a deeper market.
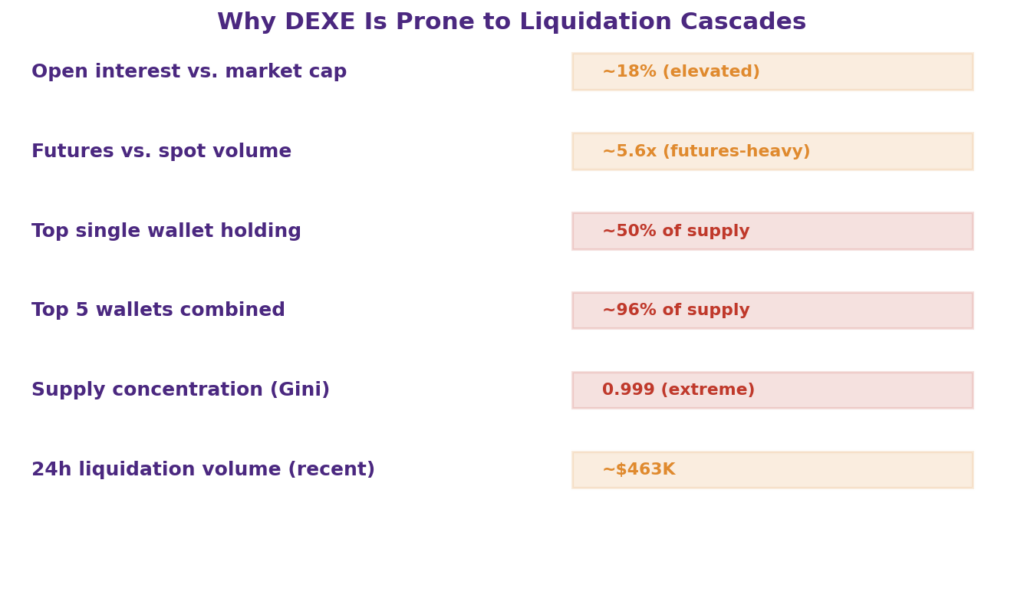
Why DEXE is prone to liquidation cascades
Several structural factors compound this specifically for DEXE. Its open interest-to-market-cap ratio sits around 18%, notably elevated, meaning a large share of the token’s value is tied up in leveraged bets rather than spot holdings. Futures volume regularly runs 5-6 times spot volume, confirming that most DEXE trading activity is leverage-driven rather than genuine buying and selling of the underlying token.
Most strikingly, DEXE’s holder base is extremely concentrated: one wallet holds roughly half of total supply, the top five wallets combined control nearly 96%, and the token’s overall distribution scores close to the maximum possible concentration on standard inequality measures. This concentration is explicitly one of the factors that data providers flag as distorting liquidation map reliability for altcoins, since a small number of large holders can have an outsized effect on both price and the liquidation clusters that form around it.
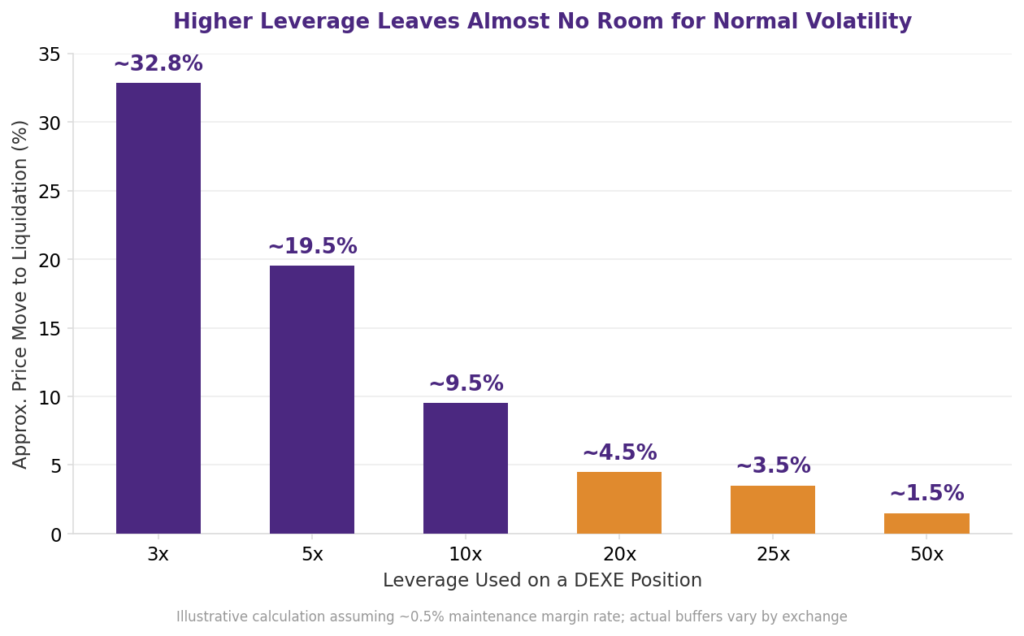
Leverage directly determines how far DEXE’s price needs to move against a position before it gets liquidated: the higher the leverage, the smaller the price move required to wipe out the position entirely.
Affect of leverage on DEXE liquidations
The standard liquidation price formula, per our guide to calculating futures liquidation price, is: Liquidation Price = Entry Price − (Initial Margin ÷ (Position Size × Maintenance Margin Rate)) for a long position.
Using DEXE’s recent price around $2.49 as an example, a long position at 5x leverage has roughly 19-20% of room before liquidation, while the same position at 50x leverage has only about 1.5% of room.
Given that DEXE has already shown single-day moves well beyond 10%, including a documented 159% spike in one day earlier in 2026, high-leverage DEXE positions carry meaningfully more liquidation risk than the same leverage would on a less volatile, more liquid asset.
Which Indicators Should You Combine With a DEXE Liquidation Map?
A DEXE liquidation map works best alongside open interest trends, funding rates, the long-short ratio, and order-book depth, since no single indicator reliably confirms what a heatmap only estimates.
Open interest: rising OI alongside price movement suggests fresh leveraged positions building, not just existing ones closing.
A DeXe liquidation map is a genuinely useful tool for visualizing where leveraged positions are likely to face forced closure, but it’s an estimate built on assumptions, not a confirmed record of every trader’s exact liquidation price. That gap between model and reality matters more for DEXE than for Bitcoin or Ethereum, given its elevated open interest ratio, futures-heavy trading activity, and extreme holder concentration. Treat DEXE’s liquidation clusters as zones of elevated risk worth watching, not precise levels to trade against mechanically, and pair the heatmap with open interest, funding rate, and order-book data before drawing conclusions from color alone.
Ready to explore DEXE and other futures markets? Download the Mudrex app for Android or iOS, or subscribe to the Mudrex YouTube channel for more explainers like this one.
FAQs
What is a DeXe liquidation map?
A DeXe liquidation map is a color-coded chart estimating where clusters of leveraged DEXE futures positions would be forcibly closed at different price levels.
How is a DEXE liquidation heatmap calculated?
It combines open interest data with assumed leverage distributions and standard maintenance margin formulas to model where liquidation clusters likely sit.
What do bright colours indicate?
Bright colors indicate a denser estimated concentration of leveraged positions at that price level, meaning a larger potential liquidation cascade if price reaches it.
Are DEXE liquidation levels accurate?
They’re directionally useful but not precise; DEXE’s thin open interest and extreme holder concentration make the underlying model less reliable than for Bitcoin or Ethereum.
Can a heatmap predict the DEXE price?
No. It shows where forced order flow is more likely to occur, not which direction price will move next; it’s a risk map, not a price prediction tool.
Why do low-liquidity tokens experience liquidation cascades?
Thinner markets mean the same dollar amount of forced buying or selling moves price further, and low-liquidity tokens often carry elevated leverage relative to their actual size.
Which indicators should be combined with a DEXE liquidation map?
Open interest, funding rate, the long-short ratio, order-book depth, and cumulative volume delta all add context a heatmap alone doesn’t provide.
Risk Disclaimer
Cryptocurrency derivatives trading carries a high risk of loss and is highly volatile. Leverage magnifies both potential gains and potential losses, and liquidation can result in the total loss of margined funds. The figures, examples, and heatmap mechanics described in this article are illustrative and for educational purposes only; they are not financial advice or a guarantee of future performance. Please consult a qualified financial advisor and fully understand the risks before trading leveraged products.
Siri is a writer venturing into the exciting realms of blockchain technology, cryptocurrency, and decentralized finance (DeFi), eager to explore the transformative potential of these innovations. She brings a unique perspective that bridges traditional industries and cutting-edge technology, often infused with a touch of humor through memes. She has a rich background in real estate and interior design, having previously contributed to NoBroker, where she crafted blogs and assets on these topics.