What Is the Morning Star Candlestick Pattern? How to Use It for Crypto Trading
A downtrend looks scary right up until the moment it stops. The hard part is spotting that moment before the crowd does. The morning star candlestick pattern is one of the cleanest signals traders use to catch that exact turn, the point where sellers run out of steam and buyers step back in.
Here is the quick answer. The morning star candlestick pattern is a three-candle bullish reversal signal that forms at the bottom of a downtrend. It tells you the selling pressure is fading and price may be about to climb. It shows up on Bitcoin, Ethereum, and altcoin charts just like it does on stocks, and you can trade it with clear entry, stop-loss, and target levels.
This guide breaks down what the pattern is, how to spot it, how to confirm it, and how to trade it on crypto charts without getting faked out.
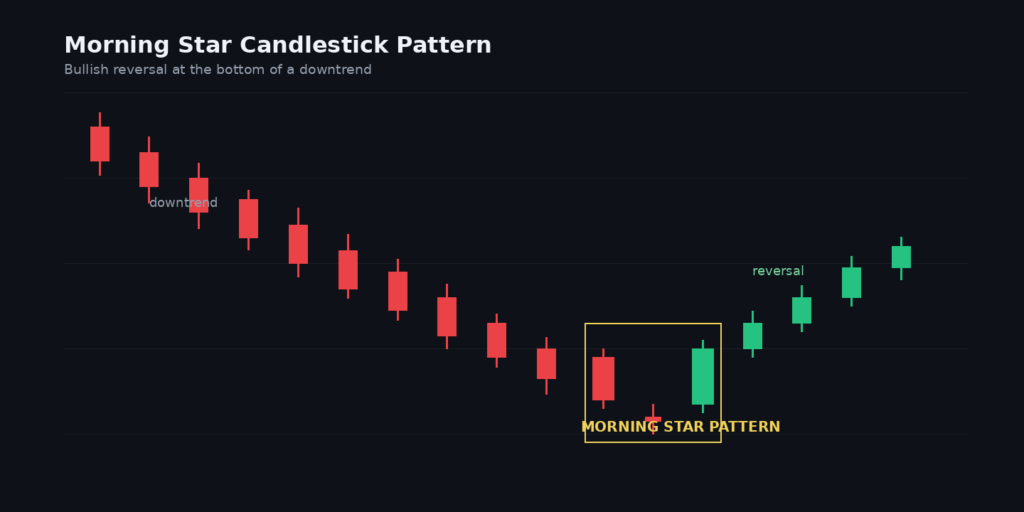
Morning star candlestick pattern forming at the bottom of a crypto downtrend
What Is the Morning Star Candlestick Pattern?
The morning star candlestick pattern is a three-candle formation that appears after a downtrend and signals a possible shift from bearish to bullish. It appears at the bottom of a downtrend and signals that the downtrend may be coming to an end and a new uptrend could begin.
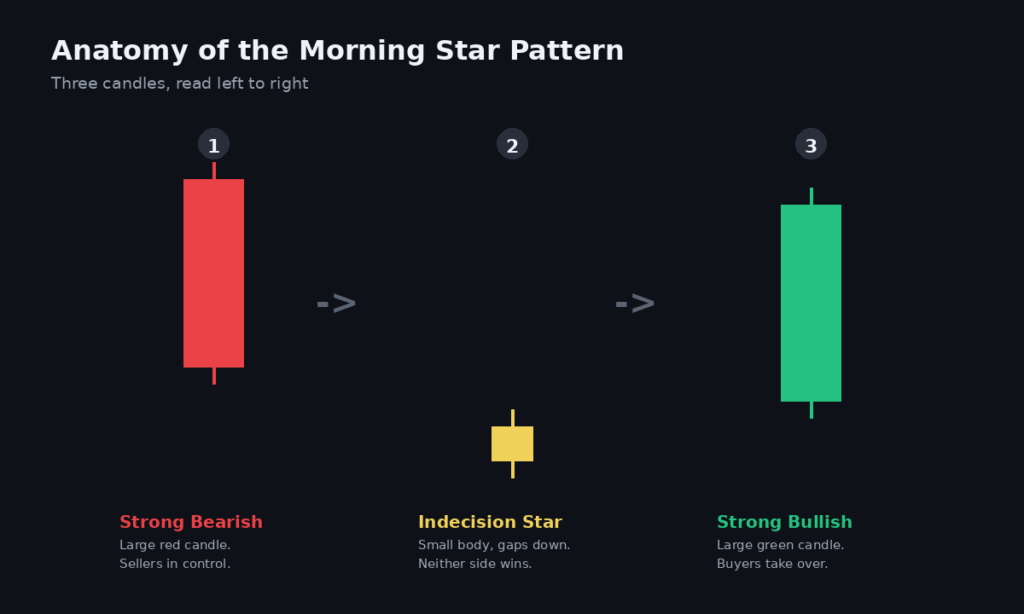
Think of it as a story told in three candles:
Anatomy of the morning star candlestick pattern: three candles explained
Candle 1: a large red (bearish) candle. Sellers are still in control.
Candle 2: a small-bodied candle, red or green. This is the indecision candle, the “star.” Neither side wins.
Candle 3: a large green (bullish) candle that pushes well into the first candle’s body. Buyers take over.
The pattern represents a gradual transfer of control from sellers to buyers, and because it develops over three sessions, many traders consider it more reliable than single-candle reversal signals. That third candle is the confirmation that momentum has flipped.
Morning Star Pattern Youtube Video
Is the Morning Star Candlestick Pattern Bullish or Bearish?
The morning star candlestick pattern is bullish. It marks a potential bottom and a turn upward. A morning star candle indicates a gradual shift in market sentiment from bearish to bullish, suggesting that sellers are exhausted and buyers are regaining control.
Its mirror image is the evening star, which is bearish and forms at the top of an uptrend. Same three-candle logic, opposite direction. If you can read one, you can read the other.
How Is a Morning Star Candlestick Pattern Formed?
For a clean morning star pattern, you want these boxes ticked in order:
A clear prior downtrend. The pattern needs something to reverse. Mark the lower highs and lower lows first.
A strong first bearish candle. This confirms sellers are still pressing.
A small second candle that gaps or separates lower. This is the pause, the moment of balance.
A strong third bullish candle. The third candle should close above 50% of the first candle’s body with increased volume.
That last point matters. A third candle that barely nudges up is a weak signal. You want it to bite deep into the first candle’s range to trust the reversal.
Morning Doji Star vs Morning Star Candle
There is one important variation worth knowing. When the middle candle is a doji, a candle that opens and closes at nearly the same price, the pattern is called a morning doji star.
The doji shows even sharper indecision than a normal small candle, which many traders read as a stronger signal that the downtrend is exhausted. Everything else about trading it stays the same. It is still a bullish reversal, just with a more dramatic pause in the middle.
How to Confirm a Valid Morning Star Pattern
This is where most beginners go wrong. The shape alone is not enough. A morning star candlestick pattern is far more reliable when the context and the indicators agree with it.
Here is what to stack on top of the pattern:
Location at support. The highest-quality setups form after a sustained multi-session decline and appear at or near a recognised support level. A pattern at a known floor carries more weight than one floating in mid-air.
Volume on the third candle. A clear volume expansion on the third candle confirms buyer conviction. Rising volume means real money is behind the move, not a thin bounce.
RSI confirmation. Reliability improves notably when the pattern appears alongside bullish divergence on the RSI or near established support levels. An oversold RSI turning up is a strong tailwind.
MACD or moving averages. A bullish MACD cross or a bounce off a key moving average adds another layer of confluence.
The rule of thumb: the more independent signals that line up with the morning star pattern, the higher your odds. One signal is a guess. Three that agree is a setup.
How Reliable Is the Morning Star Pattern?
Reasonably reliable, but not magic. On average, the success rate of the morning star pattern can range between 52 and 75% when combined with additional tools like RSI, MACD, or volume analysis. A study by Thomas Bulkowski found the morning star has an average success rate of about 72%.
Two things to keep in mind. That range depends heavily on confirmation, and the pattern is weakest in choppy conditions. It is less effective in range-bound or sideways markets and works best in trending markets where a clear shift in sentiment is likely.
How to Trade the Morning Star Candlestick Pattern in Crypto
Here is a simple, repeatable framework for trading the morning star candlestick pattern on a crypto chart.
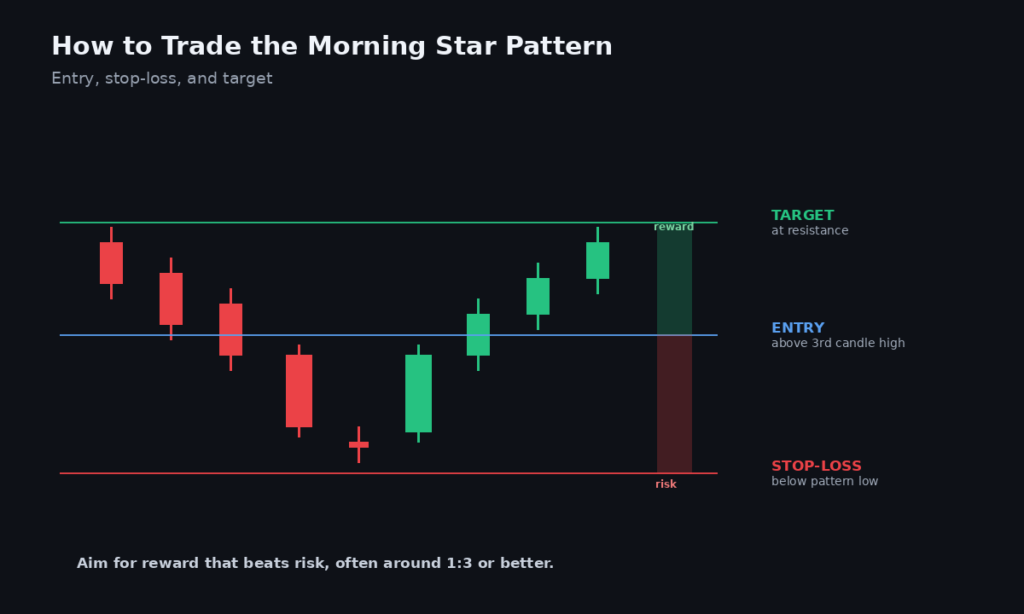
Morning Star Candlestick Pattern: 1 Signal Before a Big Reversal
Entry. You have two options depending on your risk appetite. The conservative approach is to wait for confirmation after the third candle and enter only if price trades above the high of the third candle. The aggressive approach is to enter near the close of the third candle, accepting greater risk for earlier participation.
Stop-loss. Place your stop-loss below the low of the pattern. If price breaks back below that low, the reversal has failed and you want out cheaply. Keep the stop tight but give it room past the pattern’s lowest wick.
Target. Measure the first candle’s body for a projected move, or use the next resistance level as your target above the close. Set the target before you enter so you are not improvising in the heat of the trade.
Risk-reward. Aim for a setup where the reward clearly beats the risk. A well-placed morning star trade near support can offer strong asymmetry, often in the range of 1:3 or better, meaning you risk one unit to make three.
Best Timeframe for the Morning Star Candlestick Pattern in Crypto
Crypto runs 24/7, so timeframe choice matters more than it does in stocks. The pattern shines brightest on daily or weekly charts after downtrends.
Higher timeframes filter out noise. A morning star on the daily chart reflects a full session of global participation, so it carries more conviction than one on the 5-minute chart, where a single whale order can create a fake pattern. If you trade lower timeframes, tighten your confirmation and expect more false signals.
Morning Star vs Bullish Engulfing Pattern
Both are bullish reversal signals, so which do you trust more? The difference comes down to how much evidence each gives you.
A bullish engulfing pattern is a two-candle signal: a red candle fully swallowed by a bigger green one. It is faster but gives you less confirmation. The morning star candlestick pattern spends three candles building its case, including a clear indecision phase, which is why many traders treat it as the stronger of the two. The tradeoff is that you wait longer for the signal to complete.
Can a Morning Star Candlestick Pattern Fail?
Yes. Every candlestick pattern fails sometimes, and the morning star is no exception. Like any candlestick pattern, it can produce false signals, especially if the market does not fully reverse or if the pattern forms in a weak trend.
Common failure traps to avoid:
No prior downtrend. If there was nothing to reverse, the pattern means little.
Weak third candle. A shallow close that does not reach the first candle’s midpoint dilutes the signal.
Sideways chop. In a flat market, the pattern misfires often.
No confirmation. Trading the shape alone, without volume or an indicator backing it, is how you get faked out.
This is exactly why the stop-loss below the pattern low is non-negotiable. It caps the damage when a signal fails.
The Bottom Line
The morning star candlestick pattern is one of the most trusted bullish reversal signals in technical analysis, and it works on crypto charts as well as it does anywhere else. Three candles, a downtrend fading, a pause, then buyers taking control. Spot it near support, confirm it with volume and RSI, enter above the third candle, and protect the trade with a stop below the pattern low.
Used on its own, it is a coin flip with an edge. Used with confirmation and disciplined risk management, it becomes a genuinely useful tool for timing entries in a falling market.
Ready to put it into practice? Pull up a Bitcoin or Ethereum chart on Mudrex/TradingView, scan recent downtrends for the three-candle shape, and paper-trade a few setups before risking real capital. When you are ready to trade, explore crypto futures on Mudrex.
Disclaimer: This article is for educational purposes only and is not financial advice. Candlestick patterns are not guarantees, and trading carries a high risk of loss. Cryptocurrency markets are volatile. Always do your own research and never trade more than you can afford to lose.
FAQ
What is a morning star candlestick pattern?
A morning star candlestick pattern is a three-candle bullish reversal formation that appears at the bottom of a downtrend. It consists of a large bearish candle, a small indecision candle, and a large bullish candle, signaling that sellers are losing control and buyers are stepping in.
Is the morning star pattern bullish or bearish?
It is bullish. The morning star forms after a downtrend and signals a potential reversal upward. Its opposite, the evening star, is bearish and forms at the top of an uptrend.
How is a morning star pattern formed?
It forms in three steps: a strong red candle showing selling pressure, a small-bodied candle showing indecision, and a strong green candle that closes above the midpoint of the first candle. A prior downtrend and rising volume on the third candle make it more reliable.
What confirms a valid morning star?
The strongest confirmation comes from location at a support level, a volume spike on the third candle, and agreement from indicators like RSI or MACD. The third candle should close above 50% of the first candle’s body.
Where should traders place the stop-loss?
Below the low of the pattern. If price breaks back below the lowest point of the three candles, the reversal has likely failed and the trade should be exited to limit the loss.
Which timeframe works best for crypto?
Daily and weekly charts tend to give the most reliable morning star signals because they filter out short-term noise. Lower timeframes produce more false signals and need tighter confirmation.
What is the difference between a morning star and a morning doji star?
The two are nearly identical, except the middle candle in a morning doji star is a doji, where price opens and closes at almost the same level. The doji shows sharper indecision, which many traders read as a stronger reversal signal.
Can a morning star candlestick pattern fail?
Yes. It can produce false signals, especially in sideways markets, when there is no clear prior downtrend, or when traders skip confirmation. This is why a stop-loss below the pattern low is essential.
Anupam has over 3 years of experience in the crypto industry, having worked with top indian crypto exchanges. He writes about Bitcoin, altcoins, AI, and emerging tech, helping readers understand what’s driving markets and where the digital asset ecosystem is headed.