Crypto Futures Trading During Low Volatility: Common Approaches
Your coin hasn’t moved more than 2% in a week. Your leveraged futures position feels stuck, and every strategy you know assumes price is going somewhere. Most traders either sit out or crank up leverage out of boredom, then get caught the moment the market finally moves.
Low volatility crypto trading isn’t a dead zone. It needs a different toolkit: range plans instead of trend plans, and indicators that flag when the calm is about to break. This guide covers the approaches that work, the metrics that confirm them, and the mistakes that drain accounts in quiet markets.
Key Takeaways
Quiet markets need range tools, not trend tools. Range trading, volatility contraction breakouts, and delta-neutral funding farming are the three core approaches for low-volatility crypto trading.
Don’t eyeball “quiet.” Confirm it with ATR, Bollinger Band Width, and ADX instead of guessing from the chart.
Lower your leverage, not your guard. Tight ranges tempt traders into bigger leverage for the same dollar profit, which is exactly backwards.
A squeeze always resolves. Low volatility is temporary by definition; the question is only which direction and how fast.
Stop-market beats stop-limit when you’re bracing for a breakout, because a stop-limit order can fail to fill entirely if price gaps past it.
What Does Low Volatility Crypto Trading Actually Look Like?
A low volatility crypto market is one where price moves in a tight, repeating band instead of trending, usually shown by shrinking daily ranges, falling trading volume, and flat funding rates. Traders often call this a “sideways,” “crab,” or “consolidating” market.
This isn’t the same as a dead market. Liquidity and open interest can stay healthy even while price barely moves. What’s missing is direction, not activity, and that changes which tools work.
A trending market rewards moving averages, breakout entries, and riding momentum. A range-bound market punishes those same tools with false signals and whipsaws. Crypto sideways market strategy flips the playbook: fade extremes instead of chasing them, and wait for confirmation instead of anticipating a trend.
Which Metrics Tell You Volatility Is Low?
Don’t rely on a visual “it looks flat” read. These are the numbers traders actually check.
Definition: Volatility Contraction Volatility contraction is a period where an asset’s price range shrinks steadily, usually shown by narrowing Bollinger Bands and a falling ATR, before an eventual expansion.
How Do You Trade a Range-Bound Crypto Market?
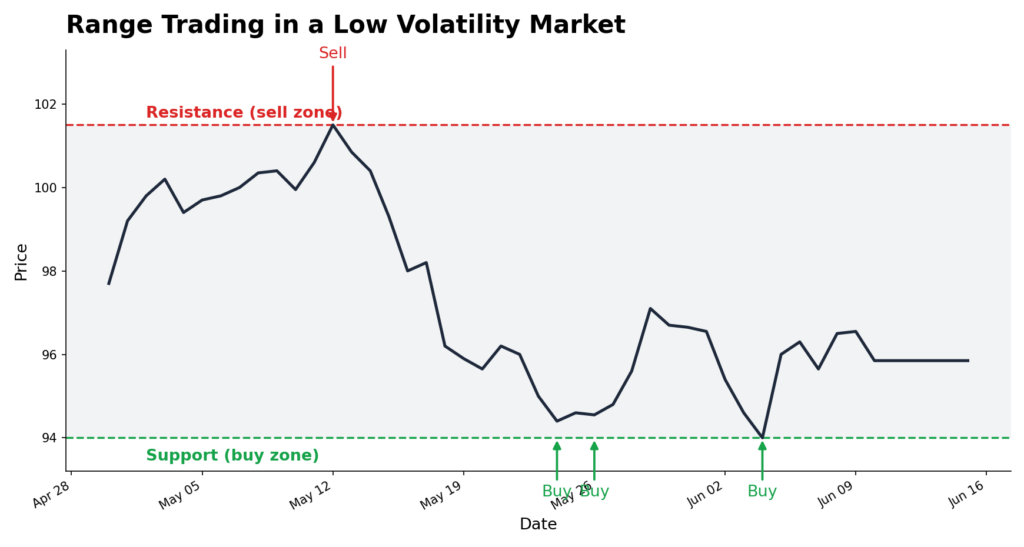
You buy near a proven support level and sell near a proven resistance level, with a tight stop just outside the range, because the entire trade idea fails the moment price actually breaks out.
Confirm the range with ADX below 20 and Bollinger Bands running flat and roughly parallel.
Enter near the edges, not the middle, so your risk-to-reward stays favourable.
Place your stop just beyond the support or resistance line, not exactly on it, to avoid being wicked out.
Take profit before the opposite edge, since the range can reverse before reaching it.
The chart below shows this in practice: price bouncing between support and resistance, with entries taken at the edges rather than the middle.
Low Volatility Crypto Trading: Futures Strategies That Actually Work
This is also why an RSI reversal, one of the crypto futures scalping strategies built for shorter timeframes, works best in choppy, sideways conditions and struggles once a real trend takes hold.
How Do You Trade a Volatility Contraction Before It Breaks Out?
You wait for Bollinger Band Width to hit a multi-week low with ADX under 20, place entry orders just outside the tightened bands, and let the eventual expansion, in whichever direction it fires, carry the trade.
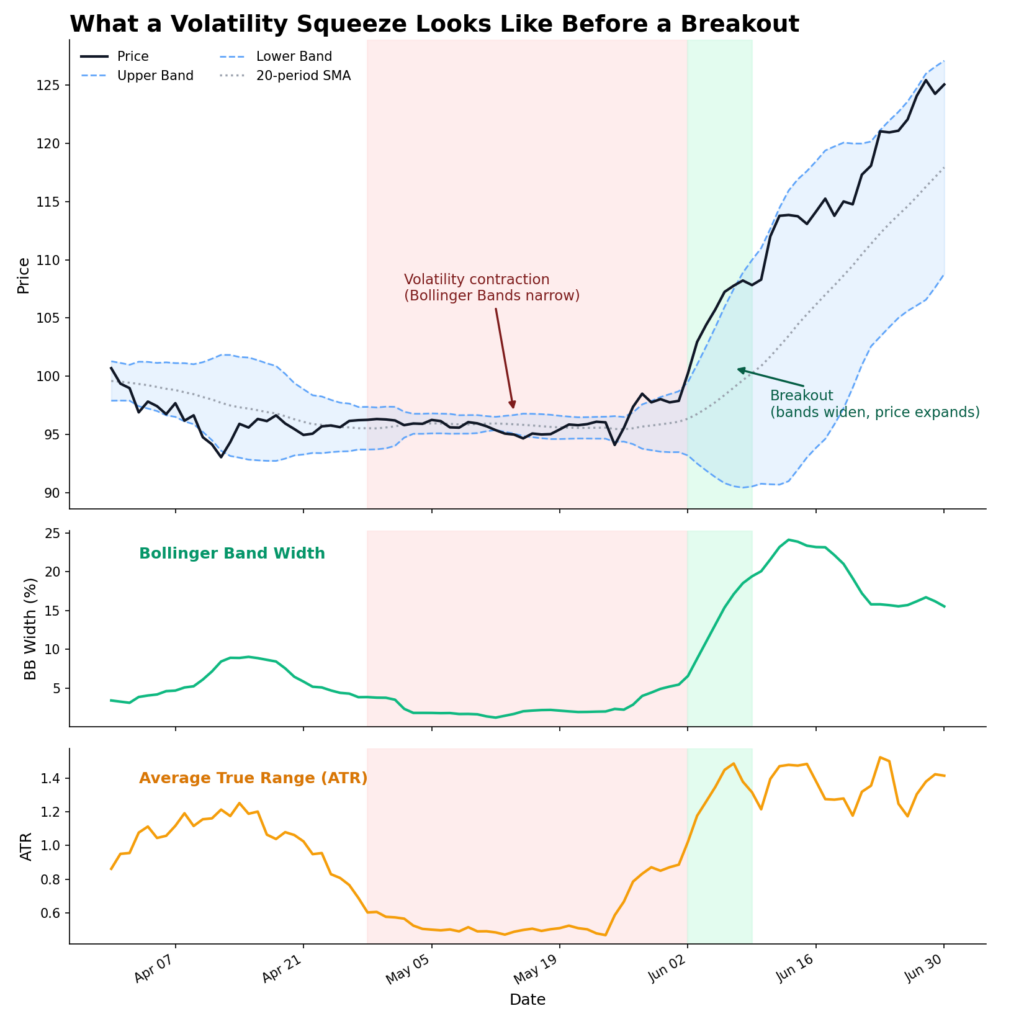
This is the “coiled spring” idea: John Bollinger’s own observation was that periods of low volatility are frequently followed by periods of high volatility. The contraction doesn’t tell you direction, only that a move is coming.
The chart below shows a full squeeze-to-breakout cycle. Watch how price tightens into a narrow band while both Bollinger Band Width and ATR fall to their lowest point, then expands sharply once the breakout starts.
Low Volatility Crypto Trading: Futures Strategies That Actually Work
Two confirmations help filter out false starts. First, check whether open interest is climbing while price stays flat, since that combination often means capital is quietly building ahead of the move. Second, don’t chase the first candle out of the range; a retest of the broken band edge, followed by price holding, filters out a good share of fakeouts.
How Does Delta-Neutral Funding Farming Work in Quiet Markets?
You hold an equal-sized spot long and futures short on the same asset so price moves cancel out, then collect the funding rate paid every 8 hours by whichever side of the market is more crowded.
Because your net price exposure is close to zero, this works whether the market drifts, chops, or briefly spikes. Your profit comes from the funding payment, not the price, which makes it a natural fit for a low-volatility trading strategy.
The table below is an illustrative example only, using simplified numbers, not real market data:
Item
Value
Spot long position
$2,000
Futures short position
$2,000 (1x leverage)
Funding rate
+0.01% per 8-hour interval
Funding earned per interval
$2,000 × 0.0001 = $0.20
Approx. funding earned per day (3 intervals)
$0.60
The payoff per trade is small, so this approach is usually judged on annualised funding yield, not single-day profit. It also isn’t free: exchange fees on both legs and a sudden funding-rate flip both eat into the edge. Check how funding rates are calculated before sizing a position this way.
Should You Use Leverage in Low Volatility Crypto Trading?
Yes, but at a lower multiple than you’d use in a trending market, because a tight range naturally pushes traders toward more leverage to make the same trade worthwhile, and that shrinks the buffer to your liquidation price right when a breakout could hit it.
A small move in a tight range often isn’t worth trading unleveraged. That’s the trap: the quieter a market looks, the more tempting it is to push leverage up, right when a sudden expansion does the most damage.
Leverage
Approx. Adverse Move to Liquidation*
5x
~20%
10x
~10%
20x
~5%
*Simplified, illustrative figures based on leverage alone; actual liquidation price also depends on maintenance margin and fees.
Most leverage in futures trading guides recommend beginners stick to 2x to 5x, and that matters even more here. A quiet market can stay quiet for days, then move fast once it breaks. Leverage sized for boredom leaves no room once the boredom ends.
What Mistakes Drain Your Account in a Quiet Market?
The three most common mistakes are overtrading small range bounces until fees erase the edge, getting stopped out by a brief false breakout before the real move, and creeping leverage up because the market has felt calm for too long.
Fee erosion. Frequent small range trades rack up exchange fees and spread costs that quietly outpace the gains.
Whipsaw fakeouts. A brief wick outside support or resistance triggers stops right before price snaps back into the range.
Complacency leverage. Leverage creeps higher because recent moves felt small, right up until the range finally breaks.
Avoiding all three takes the same discipline covered in our guide on avoiding liquidation in futures trading: fixed position sizing, a hard daily loss limit, and treating every trade the same no matter how quiet the last few days felt.
How Should You Place Stops Ahead of a Volatility Expansion?
Use a stop-market order, not a stop-limit order, when you expect a range to break, because a stop-market always triggers and fills even if the price is worse than intended, while a stop-limit can fail to fill at all if price gaps straight past your limit price.
A stop-market order becomes a regular market order the instant it triggers, so it guarantees an exit, though possibly at a worse price during a fast move (slippage). A stop-limit order only fills at your exact limit price or better, so a breakout candle can jump straight past it and leave your order sitting unfilled while the position keeps losing.
This matters most right after a squeeze, since that’s exactly when price is likely to gap. Our guide on why futures positions get liquidated despite a stop-loss breaks down how price gaps and thin order books turn a “protected” position into a liquidated one.
Conclusion
Low volatility crypto trading rewards patience and precision over speed. Range trading, volatility contraction breakouts, and delta-neutral funding farming all give you a way to stay active without fighting a market that isn’t trending. Confirm the setup with ATR, Bollinger Band Width, and ADX rather than a gut feel, size leverage down rather than up, and use stop-market orders when you’re bracing for the calm to break.
Ready to put this into practice? Download the Mudrex app to trade crypto futures trading with built-in stop-loss and take-profit tools, or head to the Mudrex YouTube channel for walkthroughs on setting up range and breakout trades.
FAQs
What is a low volatility market?
A low volatility market is one where price moves in a narrow, repeating range instead of trending, usually shown by a falling ATR, tightening Bollinger Bands, and thinner daily price swings.
How do you trade crypto during low volatility?
Trade the range by buying near support and selling near resistance, watch for a volatility contraction that signals a coming breakout, or run a delta-neutral position to collect funding rate income while price stays flat.
Is low volatility good for futures trading?
It can be, if you switch to range and contraction strategies with smaller position sizes; it’s usually not good for trend-following or high-leverage approaches, which need real price movement to work.
Which indicators work best in low volatility?
ATR and Bollinger Band Width are the most direct ways to measure a volatility contraction, while ADX below 20 confirms the market is genuinely range-bound rather than in a weak trend.
Should you use leverage in low volatility markets?
Yes, but at a lower multiple than usual, since a sudden breakout after a quiet period moves fast and can hit a highly leveraged liquidation price before a stop-loss has time to fill.
How do you identify volatility contraction?
Look for Bollinger Band Width falling to a multi-week low alongside a declining ATR and an ADX reading under 20, which together confirm the market is compressing rather than just pausing briefly.
Disclaimer: Crypto futures trading involves substantial risk, including the potential loss of your entire margin, and leverage magnifies both gains and losses. All figures, percentages, and worked examples in this article are simplified and illustrative only, not real market data, financial advice, or a guarantee of any outcome. Always assess your own risk tolerance before trading crypto futures.
Siri is a writer venturing into the exciting realms of blockchain technology, cryptocurrency, and decentralized finance (DeFi), eager to explore the transformative potential of these innovations. She brings a unique perspective that bridges traditional industries and cutting-edge technology, often infused with a touch of humor through memes. She has a rich background in real estate and interior design, having previously contributed to NoBroker, where she crafted blogs and assets on these topics.