If you’ve ever noticed SOL and BTC seem to rise and fall together almost every day, you’re not imagining it. Solana-Bitcoin correlation has sat above 0.8 for most of 2026, meaning the two assets move in near lockstep far more often than not. That matters if you’re holding both thinking you’ve diversified, or if you’re trying to time SOL trades off Bitcoin’s chart.
Here’s what the actual correlation numbers say across different timeframes, why SOL still swings harder than BTC even while moving with it, and the rare moments when the two genuinely decouple.
Key Takeaways
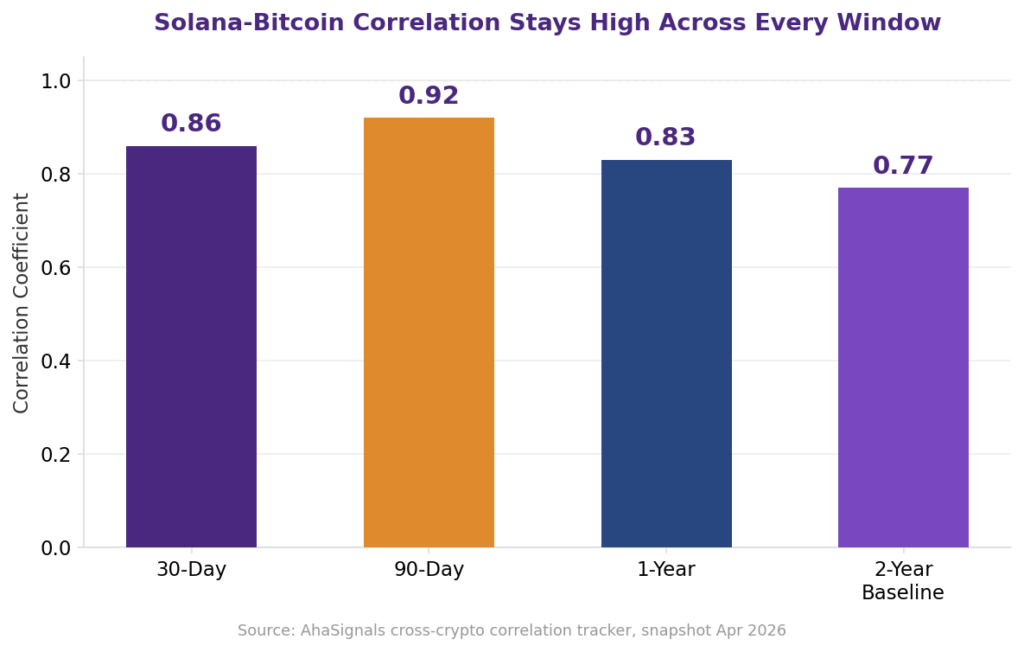
The Solana-Bitcoin correlation coefficient currently sits at 0.86 over 30 days, 0.92 over 90 days, and 0.83 over the past year, all well above the 2-year baseline of 0.77.
Correlation this high is historically unusual. Some single-week readings in late 2025 hit 0.97-0.99, near-perfect co-movement rarely seen even within crypto.
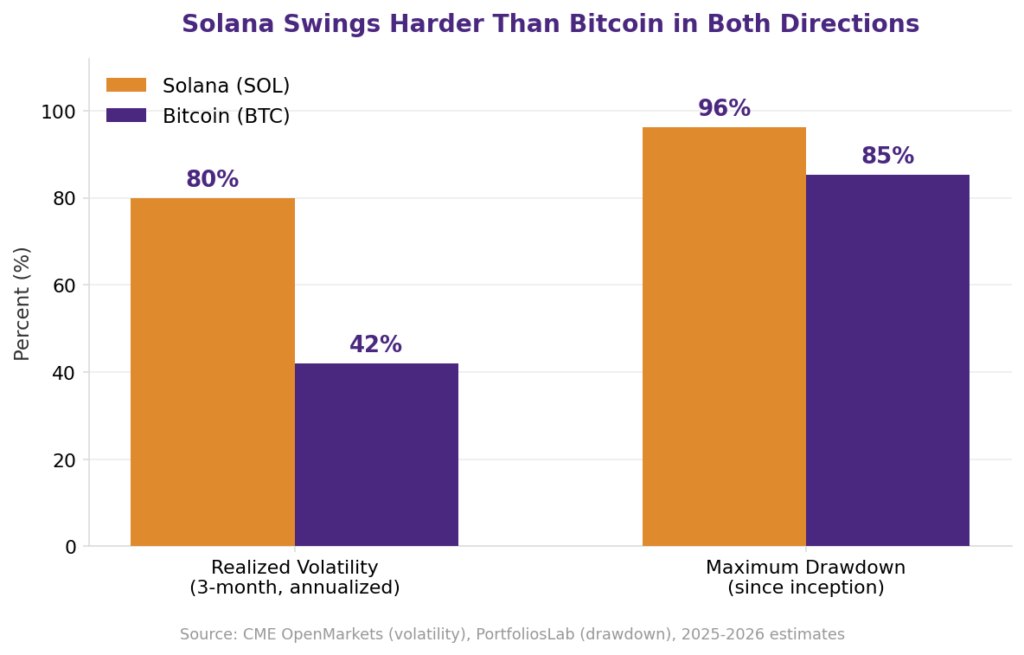
High correlation doesn’t mean identical moves. SOL’s realized volatility runs close to double Bitcoin’s, so SOL typically moves further in the same direction.
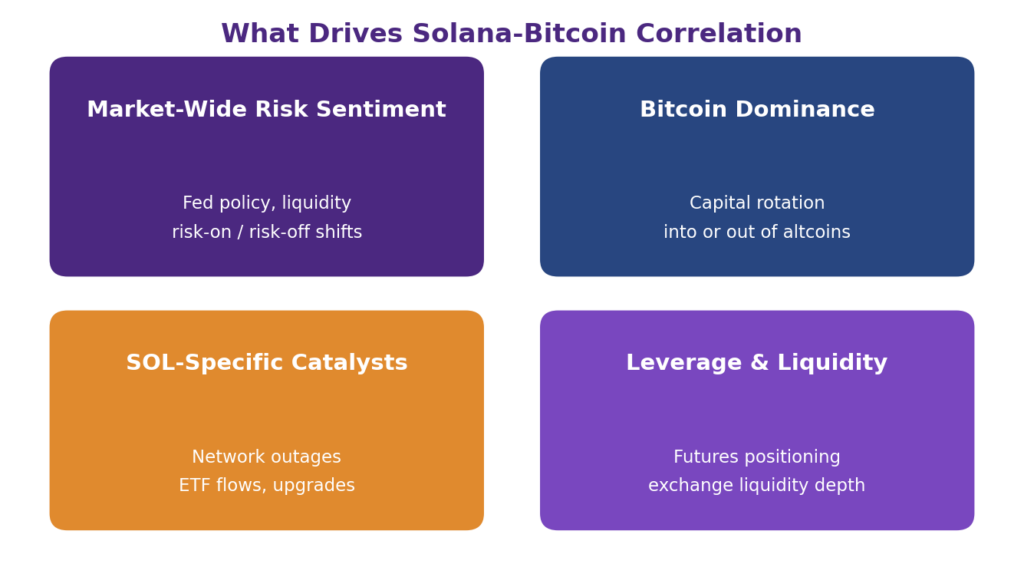
Genuine decoupling is rare but real, usually triggered by SOL-specific events like network incidents, ETF flow surges, or major protocol upgrades rather than by Bitcoin.
This correlation limits diversification benefits within a crypto-only portfolio, even though SOL and BTC still serve very different purposes as assets.
What Is the Correlation Between Solana and Bitcoin?
The Solana-Bitcoin correlation coefficient measures how closely SOL and BTC price returns move together on a scale from -1 to +1, and it currently sits between 0.83 and 0.92 depending on the time window used, indicating a strong positive relationship.
A reading near +1 means the two assets move almost perfectly together.
A reading near 0 means their price movements are unrelated.
A reading near -1 means they move in opposite directions.
Solana’s correlation with Bitcoin has stayed in the 0.77 to 0.92 range across every major timeframe through 2026, which counts as high by any standard.
Definition: Correlation Coefficient A statistical measure, typically calculated using the Pearson method, that quantifies how closely two variables, like SOL and BTC daily returns, move in relation to each other.
How Is the Solana-Bitcoin Correlation Coefficient Calculated?
The Solana-Bitcoin correlation coefficient is calculated using the Pearson correlation formula, which compares how SOL and BTC’s daily price returns move relative to their own averages over a chosen period.
In plain terms, analysts take daily percentage price changes for both assets, then measure how consistently a positive move in one lines up with a positive move in the other. The formula divides the covariance between the two return series by the product of their individual standard deviations, producing a single number between -1 and 1.
Definition: Covariance A measure of how two variables change together; positive covariance means they tend to rise and fall at the same time, while negative covariance means they tend to move in opposite directions.
You don’t need to run this calculation by hand. Correlation matrix tools and crypto data platforms compute rolling correlations automatically, updating daily as new price data comes in, which is why the same SOL-BTC pair can show different readings depending on whether you’re looking at a 30-day, 90-day, or 1-year window.
What Does the Solana-Bitcoin Correlation Look Like Across 30, 90, and 365 Days?
The Solana-Bitcoin rolling correlation is highest over medium-term windows and slightly lower over both very short and very long periods, based on recent cross-crypto correlation tracking.
Solana-Bitcoin Correlation: How Closely Do They Move?
Timeframe
Correlation Coefficient
Regime
30-day
0.86
High
90-day
0.92
Very high
1-year
0.83
High
2-year baseline
0.77
High
The 90-day window reading the highest makes sense: it smooths out short-term noise from single news events while still capturing the current market cycle, rather than diluting it with older data from a different regime the way a multi-year average does. Notably, correlation has run even higher in short bursts, with some single-week readings in December 2025 hitting 0.97-0.99 during periods of unusually synchronized, sentiment-driven trading across the entire crypto market, according to DeFiLlama-sourced reporting on the correlation spike.
Does SOL Move More Than Bitcoin During Rallies and Selloffs?
Yes. Even though SOL and BTC move in the same direction most of the time, Solana’s beta to Bitcoin means SOL typically moves by a larger percentage than BTC does, in both directions.
Definition: Beta A measure of how much an asset’s price tends to move relative to a benchmark; a beta above 1 means the asset is expected to move more sharply than the benchmark in the same direction.
Solana’s realized volatility has run close to 80% on an annualized basis during recent three-month windows, compared with roughly half that for Bitcoin, making SOL nearly twice as volatile, according to CME Group’s OpenMarkets analysis. This shows up clearly in drawdowns too: Solana’s maximum drawdown since inception sits at roughly -96%, deeper than Bitcoin’s roughly -85%.
Solana-Bitcoin Correlation: How Closely Do They Move?
The SOL/BTC price ratio makes this concrete. It peaked around 0.00182 near October 2025’s highs, then fell to roughly 0.00128 during the subsequent correction, meaning SOL lost meaningfully more value than BTC did over the same stretch, even while both fell together. This is the practical meaning of Solana-Bitcoin correlation: same direction, different magnitude.
When Does Solana Decouple From Bitcoin?
Solana decouples from Bitcoin most often when something SOL-specific happens that doesn’t affect Bitcoin at all, rather than through any change in broader market sentiment.
A clear example came in early January 2026, when SOL posted modest gains on a day Bitcoin fell over 1%, a divergence pattern that hadn’t shown up consistently since early 2024. Another came in August 2026, when a data-center routing glitch briefly knocked out close to 29% of Solana’s staked tokens; the network kept producing blocks throughout, but the incident was a purely Solana-side event with no equivalent read-through to BTC.
Other decoupling triggers worth watching include:
Solana-specific ETF flow surges, like the roughly 70x weekly inflow jump SOL spot ETFs saw in mid-August 2026, according to Coinbase market reporting, disconnected from any comparable Bitcoin ETF move.
Major protocol upgrades, such as Solana’s transaction finality improvements, which can shift sentiment on SOL specifically.
Ecosystem-specific narratives, like tokenized stock trading volume or stablecoin activity growing on Solana without a parallel Bitcoin story.
These windows tend to be short-lived. Once the SOL-specific catalyst fades, correlation with Bitcoin has historically reasserted itself within weeks.
How Does Bitcoin Dominance Affect Solana’s Price?
Bitcoin dominance, the share of total crypto market value held in BTC, acts as a rough proxy for capital rotation between Bitcoin and altcoins like Solana, including how tightly they trade together.
Solana-Bitcoin Correlation: How Closely Do They Move?
With Bitcoin dominance sitting around 58% for much of 2026, Bitcoin has continued to capture the largest share of capital inflows during periods of uncertainty, a pattern often called a “flight to crypto quality.” When dominance rises, it typically means capital is consolidating into BTC at the expense of altcoins, which can temporarily widen the performance gap between SOL and BTC even while their day-to-day correlation stays high. When dominance falls, capital tends to rotate back into altcoins, often lifting SOL more than BTC in percentage terms.
Can the Solana-Bitcoin Correlation Improve Portfolio Diversification?
Not much, if both assets are already held together. A correlation consistently above 0.8 means holding SOL alongside BTC provides limited diversification benefit within a crypto-only portfolio, since both tend to fall in the same downturns.
That said, “limited” isn’t “zero.” Because SOL carries a higher beta, it can improve risk-adjusted returns for investors specifically seeking more upside exposure during confirmed uptrends, in exchange for accepting sharper drawdowns. Some analysis has found SOL’s Sharpe ratio modestly ahead of Bitcoin’s over certain periods, meaning it delivered slightly better risk-adjusted returns despite the extra volatility, though this varies significantly by the period measured. For most investors, meaningful diversification still comes from pairing crypto with genuinely uncorrelated assets outside the space, not from mixing two high-beta cryptocurrencies. Our guide on Solana as an investment in 2026 covers how SOL’s risk profile fits into a broader portfolio context.
How Can You Track the Solana-Bitcoin Correlation Yourself?
If you want to monitor this relationship going forward, a few approaches work well depending on how deep you want to go. Crypto correlation matrix tools track rolling coefficients across dozens of pairs simultaneously, updating daily, which is useful for spotting when SOL’s relationship with BTC shifts relative to its relationship with other assets.
For a more hands-on approach, plotting the SOL/BTC ratio directly on a price chart shows relative performance at a glance, independent of the correlation coefficient itself. Our comparison of Ethereum and Solana’s ecosystems covers a similar ratio-based approach that applies just as well to a SOL/BTC pair. If you’re using correlation data to inform a hedging approach rather than just observation, our guide to hedging with crypto futures explains when a futures-based hedge is worth its cost.
Conclusion
Solana Bitcoin correlation has run consistently high through 2026, between 0.77 and 0.92 depending on the window, which means the two assets move together far more often than not. But high correlation doesn’t mean identical behavior: SOL’s higher beta and volatility mean it typically moves further in the same direction as BTC, and genuine decoupling, while rare, tends to come from SOL-specific catalysts rather than shifts in Bitcoin itself. For portfolio purposes, treat SOL and BTC as related but not interchangeable: correlated in direction, different in magnitude and risk.
Ready to track both yourself? Download the Mudrex app for Android or iOS to follow live SOL and BTC prices, or subscribe to the Mudrex YouTube channel for weekly market breakdowns.
FAQs
What is the correlation between Solana and Bitcoin?
As of 2026, the Solana-Bitcoin correlation coefficient runs between 0.77 and 0.92 depending on the timeframe measured, indicating a consistently strong positive relationship.
Does Solana always follow Bitcoin?
Not always, but usually. SOL tracks BTC’s direction most of the time, though it typically moves by a larger percentage, and occasionally decouples during SOL-specific events.
How is the Solana-Bitcoin correlation coefficient calculated?
It’s calculated using the Pearson correlation formula, comparing daily return covariance between SOL and BTC against the product of their individual standard deviations.
What does a positive Solana-Bitcoin correlation mean?
A positive Solana-Bitcoin correlation means SOL and BTC tend to move in the same direction; the closer the reading is to +1, the more closely their movements align.
Can SOL decouple from BTC?
Yes, though it’s uncommon and usually short-lived, typically triggered by SOL-specific events like network incidents, ETF flow surges, or major protocol upgrades.
Is Solana more volatile than Bitcoin?
Yes, significantly. SOL’s realized volatility has run close to double Bitcoin’s in recent three-month windows, and its maximum drawdown has been deeper too.
Which timeframe is best for Solana-Bitcoin correlation analysis?
90-day rolling correlation is often considered the most balanced, since it captures the current market regime without the noise of very short windows or the dilution of multi-year averages.
Can correlation improve portfolio diversification?
Only marginally within a crypto-only portfolio, since SOL and BTC’s correlation stays consistently high; meaningful diversification typically requires assets outside crypto entirely.
Disclaimer
This article is for informational and educational purposes. Correlation and volatility figures are historical and do not predict future price relationships. It is not financial advice, and you should consult a qualified financial advisor or DYOR before making investment decisions.
Siri is a writer venturing into the exciting realms of blockchain technology, cryptocurrency, and decentralized finance (DeFi), eager to explore the transformative potential of these innovations. She brings a unique perspective that bridges traditional industries and cutting-edge technology, often infused with a touch of humor through memes. She has a rich background in real estate and interior design, having previously contributed to NoBroker, where she crafted blogs and assets on these topics.