
Leverage amplifies both opportunity and risk in crypto futures. Professional crypto traders do not guess which is the best indicator for crypto futures trading. They use a small toolkit of proven indicators and clear rules to time entries, exits, and risk.
In this guide, you will learn exactly how professionals apply the best technical indicators for crypto futures trading, how to combine them for confluence, the on-chain metrics and signals that sit alongside them, and how to avoid the classic traps that liquidate accounts.

Read this quick refresher on chart reading for context: How to read crypto charts
A trading signal is a specific, actionable call, buy X at Y, sell Z at W, usually generated by someone else’s analysis (a person, a bot, or a paid service) rather than something you calculate yourself from an indicator. This guide focuses on indicators rather than signals for a reason: an indicator teaches you to read the market yourself, while a signal asks you to trust someone else’s read.
If you’re looking for “today’s” crypto futures trading signal specifically, that’s inherently a same-day question a static guide can’t answer responsibly, any specific level posted here would be stale by the time you read it. Instead, check a source that publishes genuinely current analysis, like Mudrex Learn’s recurring Bitcoin Technical Analysis series, which covers RSI, MACD, and support/resistance for the current session.
Neither is strictly “better,” they serve different needs. Signals can save time and are useful for learning what a well-reasoned trade idea looks like, but they make you dependent on the signal provider’s accuracy and give you no way to independently judge whether a given signal still applies once conditions change. Indicators take more effort to learn but let you evaluate any market yourself, in real time, without waiting on someone else’s call. Most professional traders use indicators as their primary tool and treat signals, if they use them at all, as one more input to check against their own read of the chart.
There’s no single best indicator for crypto futures trading, professionals combine a small set of tools that each do a different job, rather than relying on one “magic” signal. The table below is the fastest way to see what each tool is actually for before you dive into the full breakdown.
| Indicator | Best For | Timeframe It Suits Best |
|---|---|---|
| Bollinger Bands | Spotting squeezes before breakouts | 1H–4H |
| Fibonacci Retracement | Buying pullbacks inside a trend | 4H–Daily |
| Moving Averages (EMA/SMA) | Defining trend direction and dynamic support | 1H–Daily |
| RSI | Reading momentum, spotting divergence | 1H–4H |
| MACD | Confirming trend and momentum shifts | 4H–Daily |
| Stochastic Oscillator | Timing turns inside a range | 15m–1H |
| VWAP | Intraday fair-value benchmark | Intraday |
| Ichimoku Cloud | Reading trend, support, and momentum together | 4H–Daily |
| Volume | Confirming whether a move is real | Any |
Most professional crypto traders use two or three of these at a time, one to define the trend, one to trigger the entry, and volume to confirm, rather than stacking every tool onto one chart. The rest of this guide breaks down each one, plus the on-chain metrics and signal sources that sit alongside pure price-chart indicators.
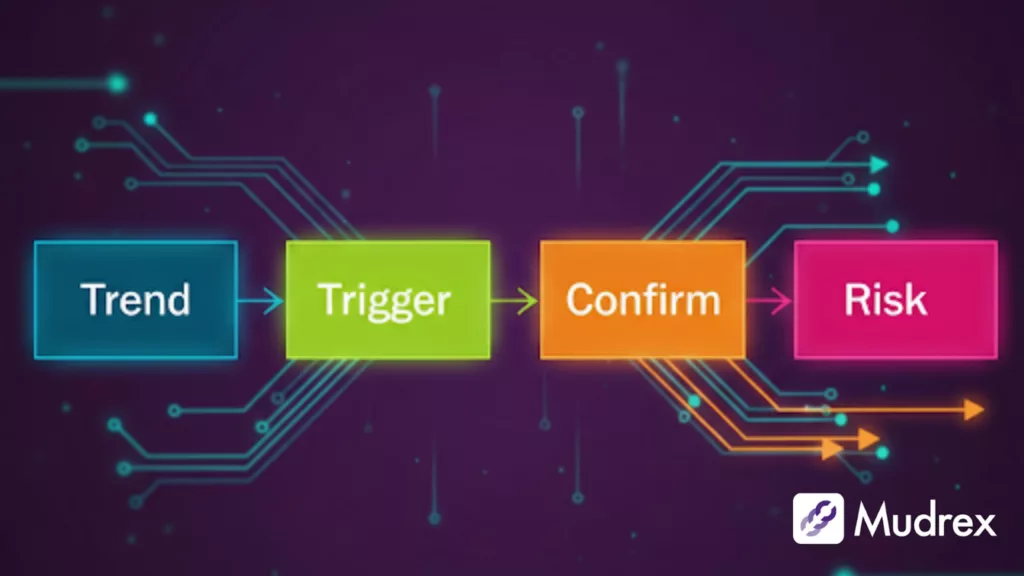
Pick one higher timeframe to find the main trend. Many traders use the 4H or Daily. Then use a lower timeframe like 1H or 15m to enter.
Follow a simple rule. Use one tool to show the trend, one tool to trigger entry, and volume to confirm. Place your stop where your idea fails, not where liquidation sits.
ALSO READ: How to trade crypto using perpetual futures
What it is: A middle moving average with two bands above and below. The bands get tight when the price is calm. They spread out when the price runs.
How pros use it:
Tips: In strong trends, price can “walk the band.” Do not fight it too early. For breakouts, place stops beyond the opposite band or below a clear swing.
ALSO READ: How to Use Bollinger Bands in crypto trading
What it is: Fibonacci retracement helps traders spot potential support and resistance zones during a trend. When the price pulls back to levels like 38.2%, 50%, 61.8%, or 78.6%, many traders look for buying opportunities in an uptrend or selling setups in a downtrend.
How pros use it:
Targets: You can scale out at old highs, or use extensions like 1.272 and 1.618 as guideposts.
ALSO READ: A quick guide to Fibonacci retracement levels
What it is: Moving averages help traders identify the overall direction of the market by filtering out short-term price fluctuations. They can also act as dynamic support in an uptrend or resistance in a downtrend. EMAs respond quickly to recent price changes, making them useful for short-term trades, while SMAs provide a broader, slower view of the trend.
How pros use it:
Watch out: Moving average crossovers can give false signals in sideways or choppy markets, leading to whipsaws. That’s why traders often confirm the trend on a higher timeframe before acting on a crossover. This reduces the chances of getting trapped in short-lived moves.
Build chart reading skills: How to analyze crypto charts | Moving Averages in Crypto Trading
What it is: RSI measures the strength of price momentum and helps spot overbought or oversold conditions. In strong uptrends, RSI may hold above 40-50, while in downtrends it often stays below 50-60. Watching these shifts gives traders early clues about potential reversals or continuation of the trend.
How pros use it:
Note: Do not short only because RSI is high in a strong uptrend. Use RSI as context, not as the only trigger.
The default 14-period RSI is the standard most platforms ship with, and it’s the right starting point for swing trading on the 4H or Daily. For faster intraday setups, some traders shorten it to a 7 or 9-period RSI to catch momentum shifts earlier, at the cost of more false signals in choppy conditions. A practical rule of thumb: keep the 14-period setting for trend confirmation on higher timeframes, and only shorten the period if you’re specifically scalping on the 5m or 15m chart and have tested the setting against your own trade log first.
A 1-hour RSI reading changes with every new hourly candle, so any specific number published here would already be outdated by the time you read it. Instead of guessing, check the live 1H RSI directly on a charting platform (TradingView, or your exchange’s own chart) before you trade off it. As context for reading whatever number you see: RSI above roughly 70 on the 1H is typically read as short-term overbought, below roughly 30 as short-term oversold, and readings holding in the 40-60 band usually reflect a market without a strong short-term directional bias. Pair the live reading with the broader 4H or Daily trend rather than trading the 1H RSI in isolation.
What it is: MACD combines trend and momentum into one indicator, making it useful for spotting shifts in market strength. When the MACD line crosses above the signal line near the zero line, it can signal the start of bullish momentum, while a cross below may suggest bearish pressure. The histogram helps visualize these changes, showing when momentum is building or fading.
How pros use it:
Tip: Pair MACD with a 200 EMA trend filter and price structure. Let volume confirm the trigger candle.
ALSO READ: How to Use the Moving Average Convergence Divergence (MACD)
What it is: The stochastic oscillator highlights overbought and oversold conditions, especially effective in range-bound markets. When %K crosses above %D near the 20 level, it can hint at a potential bounce, while a cross near 80 may suggest a pullback. Traders often use it to fine-tune entries and exits within sideways price action.
How pros use it:
Avoid: Using stochastic to fade a strong trend without higher timeframe support.
Walkthrough: Stochastic oscillator in crypto trading
Why 1H: The 1-hour moving average gives traders a reliable balance between short-term signals and broader trend clarity. It’s fast enough to catch intraday moves but smooth enough to filter out excessive noise. Many swing and day traders use it as their go-to timeframe for spotting setups and managing trades.
A simple 1H plan:
Heads up: News spikes can cut through lines. Do not take trades right into events.
ALSO READ: Top crypto trading strategies
What it is: The Ichimoku Cloud offers a full picture of the market by showing trend direction, potential support or resistance, and momentum shifts all at once. A price above the cloud often signals strength, while a price below points to weakness. Crosses of the Tenkan and Kijun lines add further confirmation, making it a versatile tool for both trend and range traders.
How pros use it:
Skim a quick indicator list: Technical indicators for crypto day trading
What it is: Volume reveals the strength behind price movements by showing how many participants are actively trading. A strong trend accompanied by high volume is more likely to continue, while moves on low volume may fizzle out. Traders use it as a “truth check” to confirm breakouts, reversals, or trend sustainability.
How pros use it:
Note: Weekend activity can be slow. Thin pairs can show odd spikes. Choose pairs with steady volume.
Learn the basics: What is volume in cryptocurrency
Beyond the core nine, several other tools show up regularly on professional crypto futures charts, particularly for intraday and scalping setups.
Both blend price and volume, but they answer different questions.
| VWAP | VWMA | |
|---|---|---|
| What it measures | The average price a coin has traded at today, weighted by volume | A moving average of recent candles, weighted by volume |
| Resets | Yes, typically at the start of each trading day | No, it’s a rolling average over a fixed number of periods |
| Best use | Intraday fair-value benchmark, institutional traders often buy below VWAP and sell above it | Trend and momentum confirmation over a chosen lookback period, similar to an EMA but volume-aware |
| Best timeframe | Intraday (5m-1H) | Any, commonly 4H-Daily for trend work |
In short: VWAP tells you where today’s “fair price” sits; VWMA tells you whether the trend, weighted by conviction, is turning.
Williams %R is a momentum oscillator similar to stochastic, scaled from 0 to -100, where readings above -20 suggest overbought conditions and readings below -80 suggest oversold conditions. The default 14-period setting works well on 1H-4H charts for swing entries. For faster scalping setups, some traders shorten it to a 9-period setting, similar to the RSI adjustment above, trading faster signals for more noise.
ROC (Rate of Change) measures the percentage change in price over a set number of periods, a straightforward momentum reading. A rising ROC confirms accelerating momentum in the direction of the move; a ROC that flattens or turns while price keeps climbing is an early divergence warning, similar in spirit to RSI divergence but based purely on percentage price change rather than a bounded oscillator.
Supertrend plots a single line above or below price based on volatility (ATR), flipping color when the trend changes, popular for its simplicity as a trailing-stop and trend-filter tool in one. Order blocks, borrowed from institutional/smart-money trading concepts, mark the last opposing candle before a strong impulsive move, on the theory that large orders were placed there and price may return to “fill” that zone before continuing. Both are more discretionary than the indicators above and work best as confluence with a trend tool and volume, not as standalone signals.
Chart indicators read price and volume. On-chain and derivatives metrics read what’s happening underneath the price, and professional futures traders increasingly check both before sizing a trade.
These are genuinely “global” indicators in the sense that they aggregate data across spot and futures markets rather than reading a single price chart, which is why professional traders treat them as context for a trade, not a replacement for the chart-based indicators above.
Go deeper: How open interest impacts crypto futures | Crypto funding rates explained
The “best” indicator set changes with your holding period. A tool that works well for a multi-day swing trade can be too slow for a five-minute scalp, and vice versa.
| Style | Typical Timeframe | Best-Fit Indicators | What to Prioritize |
|---|---|---|---|
| Scalping | 1m-5m | VWAP, fast Stochastic or Williams %R (9-period), Volume | Speed of signal over confirmation depth |
| Day trading | 15m-1H | RSI (14), MACD, 1H moving averages, VWAP | Balance between speed and false-signal filtering |
| Swing trading | 4H-Daily | Moving averages (20/50/200), Fibonacci retracement, Ichimoku Cloud, on-chain metrics | Trend confirmation and patience over speed |
Whichever style you trade, the same underlying rule from earlier in this guide still applies: one tool for trend, one tool for the trigger, and volume (or VWAP, for intraday styles) to confirm.
You do not need many tools. Pick two that play different roles and add volume.
Three tested combos:
Write your rules. Where to enter, where to exit, where to stop, and how much size to use.
Learn how trend changes start with our blog on trend reversal signals
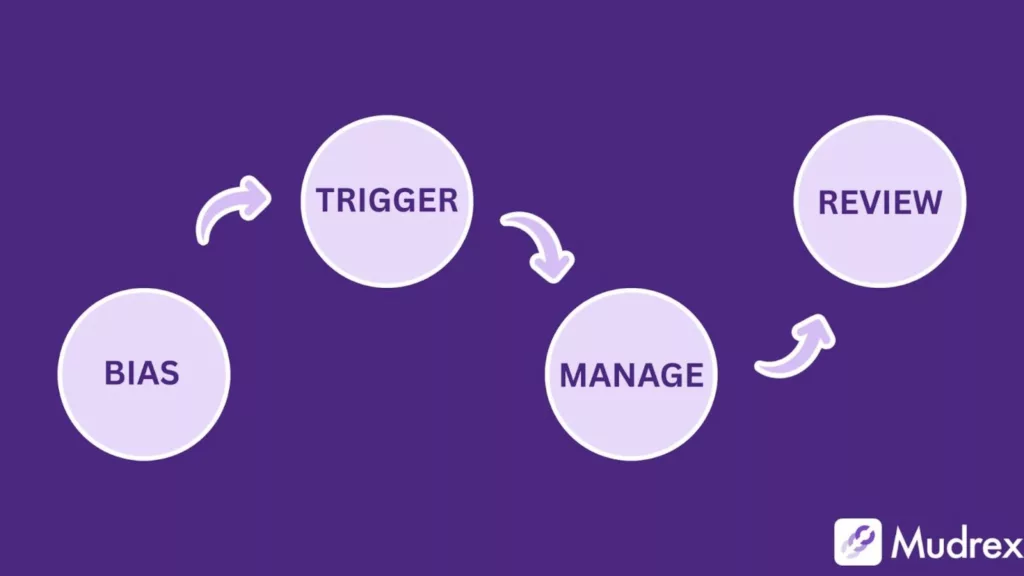
Start with the bias on the Daily or 4H. Move down to the 1H or 15m to time entries. Use alerts so you are not glued to the screen.
Plan your exits before you enter. Take partial profits at old highs or at a simple fib extension. Move your stop only when structure changes, not because you feel fear.
Pair price with sentiment data: Spot market sentiment tools
Leverage makes small mistakes big. Risk a small, fixed percent of your account per trade. Many traders keep it under 1 percent.
Set your stop where the idea fails. For example, below the 1H 50 in a 1H pullback plan. Use reduce-only orders to scale out. Keep a daily loss limit. If you hit it, stop for the day.
ALSO READ: How open interest impacts crypto futures
BTC breakout from a squeeze: A 4H Bollinger squeeze forms in an uptrend. Price closes outside the upper band on the 1H with a clear volume spike. MACD flips above zero. Entry comes on a small pullback. Stop goes below the mid-band. Profits are taken at the prior high and a small extension. Clean and simple.
ETH pullback to the golden pocket: Daily trend is up. On 1H, ETH pulls back into the 50 to 61.8 zone, right near the 20 EMA. RSI holds above 40. Stochastic crosses up. Entry is on a strong green candle. Stop sits below the 65 percent level. Profits taken at the last swing high and at 1.272.
Learn the golden pocket idea: Golden ratio and golden pocket
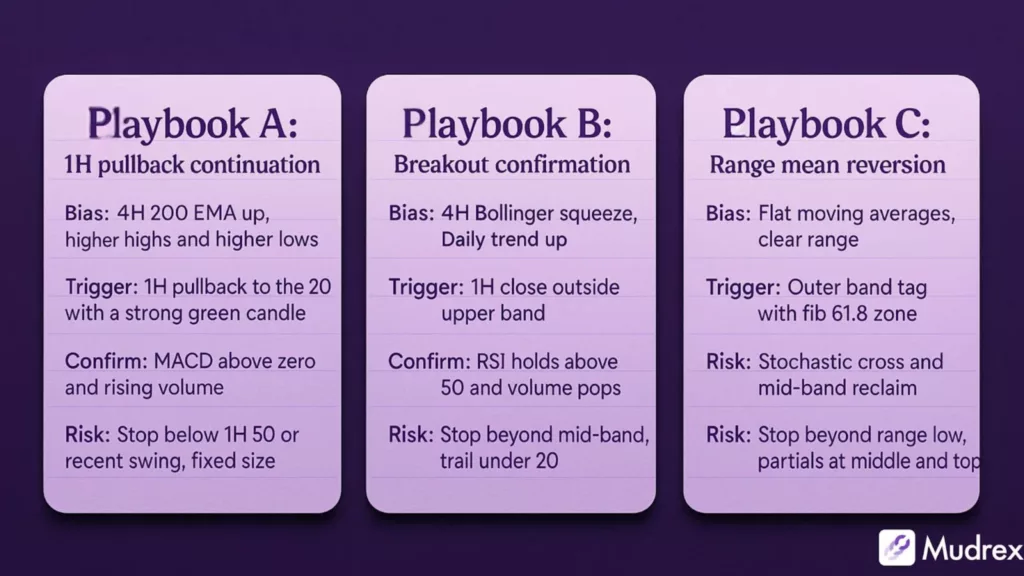
Professional tools are simple. You pick a trend guide, a clear trigger, and a volume check, and you back it with on-chain context like funding rate and open interest. You place a stop where the idea fails. Over time, this routine helps you avoid noise and follow strong moves. Use the indicators in this guide to build two or three clear playbooks. Then practice, journal, and improve.
Keep learning with more guides on Mudrex Learn, download the Mudrex app on Android or iOS, or subscribe to the Mudrex YouTube channel for short lessons and live walkthroughs.
There is no single best indicator. A strong mix is one trend tool like the 200 EMA, one trigger like a Bollinger breakout or a 1H pullback, and volume to confirm. This mix is simple, testable, and easy to repeat.
A small, useful set is Bollinger Bands, Fibonacci levels, 20-50-200 moving averages, RSI, MACD, stochastic, VWAP, Ichimoku Cloud, and volume. Pick two roles and keep one as a backup. Add volume each time.
The 14-period RSI is the standard default and works well for swing trading on 4H-Daily charts. Shorter periods (7-9) react faster but generate more false signals, and are better suited to scalping timeframes if you’ve tested them against your own trade history first.
ROC (Rate of Change) measures the percentage change in price over a set number of periods. It’s a straightforward momentum reading: rising ROC confirms accelerating momentum, while a flattening ROC against rising price can flag early divergence.
VWAP is an intraday benchmark that resets daily and shows the volume-weighted average price traded so far today. VWMA is a rolling moving average weighted by volume over a fixed lookback period, and doesn’t reset, making it closer to a volume-aware EMA than to VWAP.
No single indicator is “most accurate” on its own; accuracy comes from combining a trend tool (moving averages or Ichimoku) with price structure and volume, not from picking one indicator in isolation. Among individual tools, the 200-period moving average is the one most professional traders treat as the baseline trend filter.
Start with the highest timeframe you care about to set your bias (uptrend, downtrend, or range), then layer one trend indicator, one momentum or entry-trigger indicator, and volume on top. Read the trend first, the trigger second, and use volume to confirm before acting, rather than reading all three at once.
None. Markets change. Indicators read price and crowd behavior. Good risk rules and steady practice matter more than any single tool.
A common and robust plan is trend following. Find a 4H uptrend. Enter on a 1H pullback to the 20 EMA. Confirm with MACD above zero and rising volume. Use a fixed stop and take partial profits at old highs.
For scalping (1m-5m), VWAP, a fast Stochastic or Williams %R, and volume prioritize speed. For day trading (15m-1H), RSI, MACD, 1H moving averages, and VWAP balance speed with fewer false signals. See the comparison table above for the full breakdown by trading style.
Same principle as crypto specifically: no single indicator wins in isolation. Moving averages for trend, RSI or MACD for momentum confirmation, and volume for validation is the combination most professional futures traders default to, across both crypto and traditional futures markets.
For spot crypto trading without leverage, the same core combination applies, trend (moving averages), momentum (RSI or MACD), and volume, though the stakes and stop-placement discipline matter less than in leveraged futures trading.
Professional crypto traders typically use a small, repeatable set rather than a large indicator stack: one trend tool (moving averages or Ichimoku), one momentum or entry trigger (RSI, MACD, Bollinger Bands, or stochastic), volume for confirmation, and on-chain context (funding rate, open interest) before sizing the trade.
Crypto futures trading involves substantial risk, including the potential loss of your entire margin. Leverage magnifies both gains and losses. Technical indicators, on-chain metrics, and trading signals discussed in this article are tools for analysis, not guarantees of future price movement, and none of them are accurate 100% of the time. This content is for educational purposes and does not constitute financial advice. Please consult a qualified financial advisor and only trade with capital you can afford to lose.